

Question: An automatic device is used to count the volume of traffic at a busy intersection. The arrival time is recorded and translated into an absolute
An automatic device is used to count the volume of traffic at a busy intersection. The arrival time is recorded and translated into an absolute time starting from zero. The following table provides the arrival times (in minutes) for the first 60 cars. Use Excel to construct a suitable histogram. Test the hypothesis that the interarrival time is exponential using a 95% confidence level.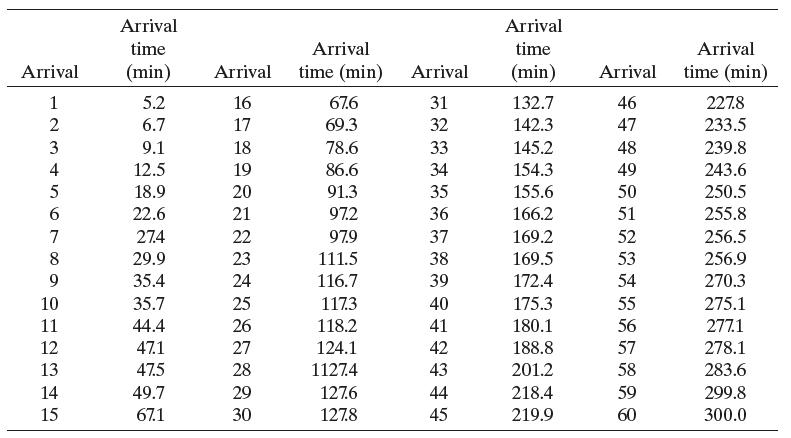
Arrival 1 6789SFW23 4 5 10 11 12 13 14 15 Arrival time (min) 5.2 6.7 9.1 12.5 18.9 22.6 27.4 29.9 35.4 35.7 44.4 47.1 47.5 49.7 67.1 Arrival 16 17 18 19 20 21 22 23 24 25 26 27 28 29 30 Arrival time (min) 67.6 69.3 78.6 86.6 91.3 97.2 97.9 111.5 116.7 117.3 118.2 124.1 1127.4 127.6 127.8 Arrival 31 32 33 34 35 36 37 38 39 40 41 42 43 44 45 Arrival time (min) 132.7 142.3 145.2 154.3 155.6 166.2 169.2 169.5 172.4 175.3 180.1 188.8 201.2 218.4 219.9 Arrival 46 47 48 49 50 51 52 53 54 55 56 57 58 59 60 Arrival time (min) 227.8 233.5 239.8 243.6 250.5 255.8 256.5 256.9 270.3 275.1 277.1 278.1 283.6 299.8 300.0
Step by Step Solution
3.49 Rating (159 Votes )
There are 3 Steps involved in it
To create a histogram in Excel we first need to create a frequency table that groups the data into intervals We can start by finding the range of the ... View full answer

Get step-by-step solutions from verified subject matter experts