

Question: using excel thank you Case Analysis An automatic device is used to count the volume of traffic at a busy intersection. The device records the
using excel thank you
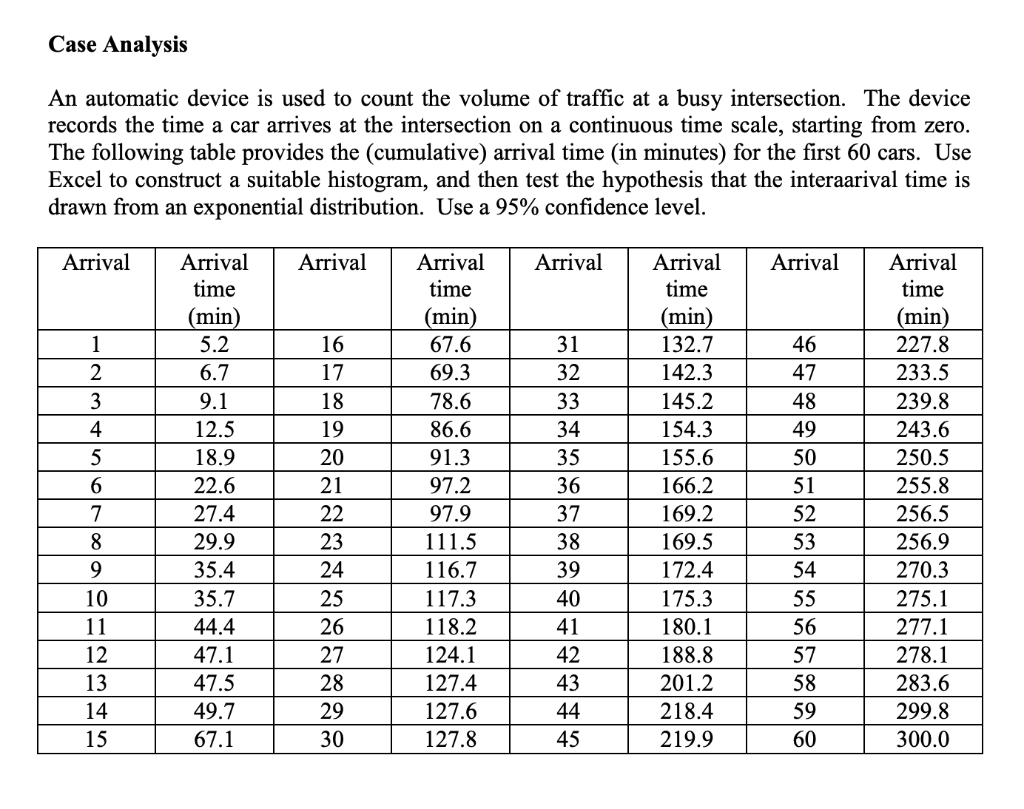
Case Analysis An automatic device is used to count the volume of traffic at a busy intersection. The device records the time a car arrives at the intersection on a continuous time scale, starting from zero. The following table provides the (cumulative) arrival time (in minutes) for the first 60 cars. Use Excel to construct a suitable histogram, and then test the hypothesis that the interaarival time is drawn from an exponential distribution. Use a 95% confidence level. Arrival Arrival Arrival Arrival 1 2 3 4 5 6 7 8 9 10 11 12 13 14 15 Arrival time (min) 5.2 6.7 9.1 12.5 18.9 22.6 27.4 29.9 35.4 35.7 44.4 47.1 47.5 49.7 67.1 16 17 18 19 20 21 22 23 24 25 26 27 28 29 30 Arrival time (min) 67.6 69.3 78.6 86.6 91.3 97.2 97.9 111.5 116.7 117.3 118.2 124.1 127.4 127.6 127.8 31 32 33 34 35 36 37 38 39 40 41 42 43 44 45 Arrival time (min) 132.7 142.3 145.2 154.3 155.6 166.2 169.2 169.5 172.4 175.3 180.1 188.8 201.2 218.4 219.9 46 47 48 49 50 51 52 53 54 55 56 57 58 59 60 Arrival time (min) 227.8 233.5 239.8 243.6 250.5 255.8 256.5 256.9 270.3 275.1 277.1 278.1 283.6 299.8 300.0Step by Step Solution
There are 3 Steps involved in it
1 Expert Approved Answer
Step: 1 Unlock

Question Has Been Solved by an Expert!
Get step-by-step solutions from verified subject matter experts
Step: 2 Unlock
Step: 3 Unlock