

Question: Sketch on separate axes, in the interval 0 360, the graphs of: In each case show the coordinates of any maximum and
Sketch on separate axes, in the interval 0 ≤ θ ≤ 360°, the graphs of: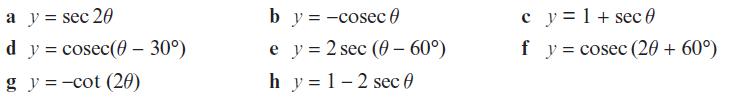
In each case show the coordinates of any maximum and minimum points, and of any points at which the curve meets the axes.
a y = sec 20 d y = cosec(0 - 30) g y=-cot (20) by = -cosec 0 e y = 2 sec (0-60) hy = 1-2 sec ( c y = 1 + sec 0 f y = cosec (20 + 60)
Step by Step Solution
★★★★★
3.44 Rating (157 Votes )
There are 3 Steps involved in it
1 Expert Approved Answer
Step: 1 Unlock

Step 1 The given function is y sec2 Step 2 Recall that the given interval ... View full answer
Question Has Been Solved by an Expert!
Get step-by-step solutions from verified subject matter experts
Step: 2 Unlock
Step: 3 Unlock