

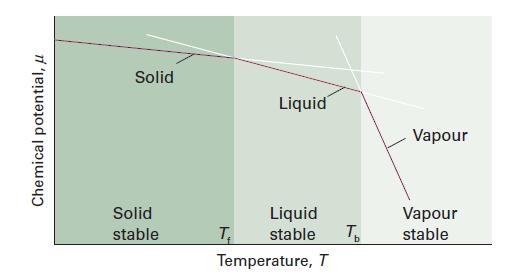
Figure 4B.1 gives a schematic representation of how the chemical potentials of the solid, liquid, and gaseous
Question:
Figure 4B.1 gives a schematic representation of how the chemical potentials of the solid, liquid, and gaseous phases of a substance vary with temperature. All have a negative slope, but it is unlikely that they are truly straight lines as indicated in the illustration. Derive an expression for the curvatures (specifically, the second derivatives with respect to temperature) of these lines. Is there a restriction on the curvature of these lines? Which state of matter shows the greatest curvature?
Data in Figure 4B.1
Fantastic news! We've Found the answer you've been seeking!
Step by Step Answer:
The curvature of a line is determined by the second derivative of the line with respect to temperatu...View the full answer

Answered By
Dansteve Matoke
As a consequence of more than three years of experience in ACADEMIC WRITING, I have vast, diverse knowledge and impeccable grammar. I guarantee the quality of my work across multiple fields. I intend to precisely meet the clients' expectations. Let's work together to achieve exceptional grades.
0 Reviews
10+ Question Solved
Related Book For 
Physical Chemistry Thermodynamics And Kinetics
ISBN: 9781464124518
10th Edition
Authors: Peter Atkins, Julio De Paula
Question Posted:
