

Question: FIGURE EX4.25 shows the angular-velocity-versus-time graph for a particle moving in a circle, starting from θ 0 = 0 rad at t = 0 s.
Figure Ex 4.25
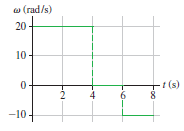
w (rad/s) 20 10 - Fr(s) -10-
Step by Step Solution
★★★★★
3.40 Rating (163 Votes )
There are 3 Steps involved in it
1 Expert Approved Answer
Step: 1 Unlock

Solve The angular position graph is the area under the angular velocity graph At t ... View full answer
Question Has Been Solved by an Expert!
Get step-by-step solutions from verified subject matter experts
Step: 2 Unlock
Step: 3 Unlock
Document Format (2 attachments)
1442_6054778b48aff_644404.pdf
180 KBs PDF File
1442_6054778b48aff_644404.docx
120 KBs Word File