

Question: FIGURE P18.62 shows two different processes by which 80 mol of gas move from state 1 to state 2. The dashed line is an isotherm.
a. What is the temperature of the isothermal process?
b. What maximum temperature is reached along the straight line process?
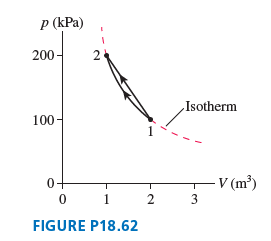
p (kPa) 200- Isotherm 100 - V (m) 2 3 FIGURE P18.62
Step by Step Solution
★★★★★
3.52 Rating (166 Votes )
There are 3 Steps involved in it
1 Expert Approved Answer
Step: 1 Unlock

Model The gas is an ideal gas Solve a Using the idealga... View full answer
Question Has Been Solved by an Expert!
Get step-by-step solutions from verified subject matter experts
Step: 2 Unlock
Step: 3 Unlock
Document Format (2 attachments)
1442_6054778b93793_693386.pdf
180 KBs PDF File
1442_6054778b93793_693386.docx
120 KBs Word File