

In 2012, Hurricane Sandy struck the East Coast of the United States, killing 147 people and causing
Question:
In 2012, Hurricane Sandy struck the East Coast of the United States, killing 147 people and causing an estimated $75 billion in damage. With a gale diameter of about 1000 miles, it was the largest ever to form over the Atlantic Basin. The accompanying data represent the number of major hurricane strikes in the Atlantic Basin (category 3, 4, or 5) each decade from 1921 to 2010.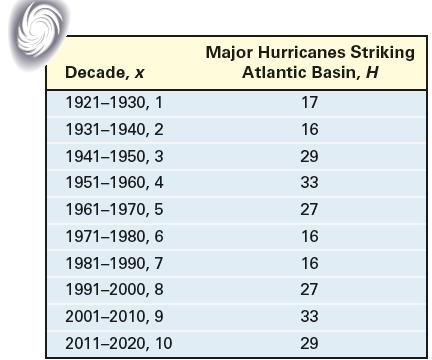
(a) Draw a scatter plot of the data. Comment on the type of relation that may exist between the two variables.
(b) Use a graphing utility to find the cubic function of best fit that models the relation between decade and number of major hurricanes.
(c) Use the model found in part (b) to predict the number of major hurricanes that struck the Atlantic Basin between 1961 and 1970.
(d) With a graphing utility, draw a scatter plot of the data and then graph the cubic function of best fit on the scatter plot.
(e) Concern has risen about the increase in the number and intensity of hurricanes, but some scientists believe this is just a natural fluctuation that could last another decade or two. Use your model to predict the number of major hurricanes that will strike the Atlantic Basin between 2021 and 2030. Is your result reasonable? What does this result suggest about the reliability of using a model to predict an event outside the domain of the data?
Step by Step Answer:

This question has not been answered yet.
You can Ask your question!


Precalculus Concepts Through Functions A Unit Circle Approach To Trigonometry
ISBN: 9780137945139
5th Edition
Authors: Michael Sullivan
