

Question: The given graph shows the temperature T in F at Davis, CA, on April 18, 2008, between 6 a.m. and 6 p.m. a. Estimate the
The given graph shows the temperature T in °F at Davis, CA, on April 18, 2008, between 6 a.m. and 6 p.m.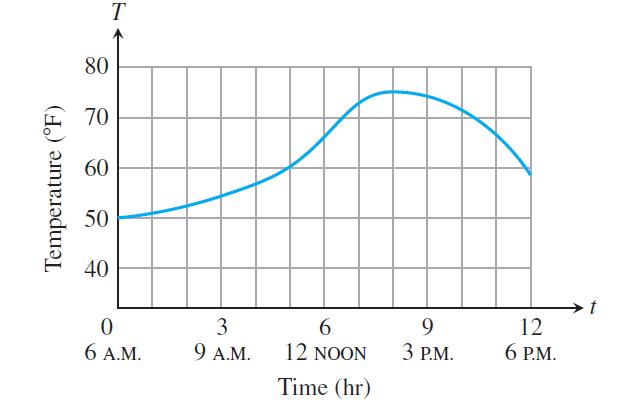
a. Estimate the rate of temperature change at the times
i) 7 a.m.
ii) 9 a.m.
iii) 2 p.m.
iv) 4 p.m.
b. At what time does the temperature increase most rapidly? Decrease most rapidly? What is the rate for each of those times?
c. Use the graphical technique of Example 3 to graph the derivative of temperature T versus time t.
Example 3
Graph the derivative of the function y = ƒ(x) in Figure 3.6a.
In Figure 3.6a.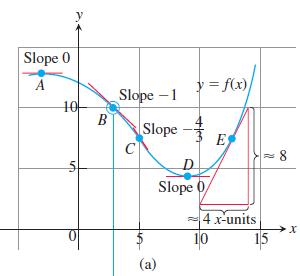
Temperature (F) 80 70 60 50 40 T 0 6 A.M. 3 9 A.M. 6 12 NOON Time (hr) 9 3 P.M. 12 6 P.M.
Step by Step Solution
3.38 Rating (148 Votes )
There are 3 Steps involved in it
a i 15 Fhr ii 29 Fhr iii 0 ... View full answer

Get step-by-step solutions from verified subject matter experts