

Question: struggling with these problems: Temperature. The given graph shows the outside temperature T in D'F, between 6am and 7pm. E? E E E E [
struggling with these problems:
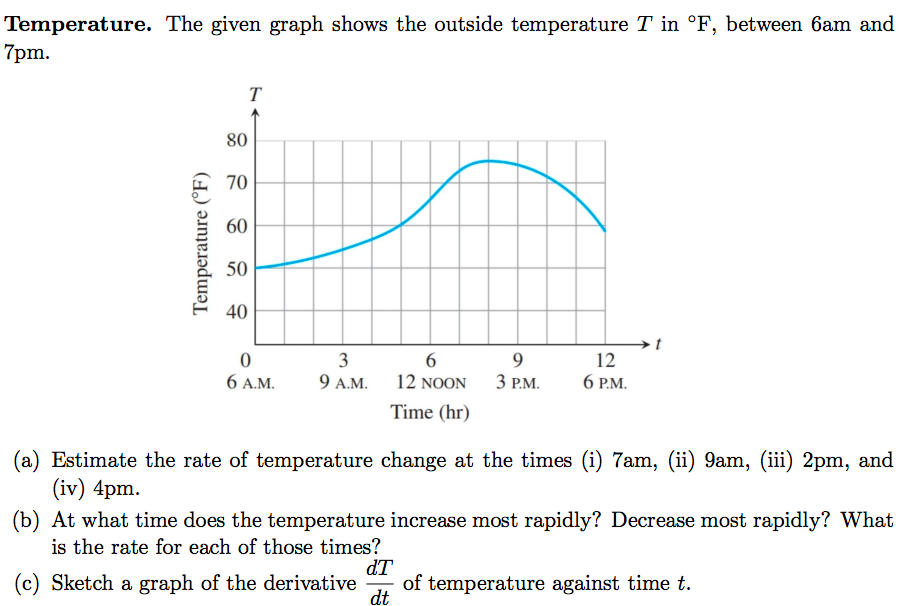
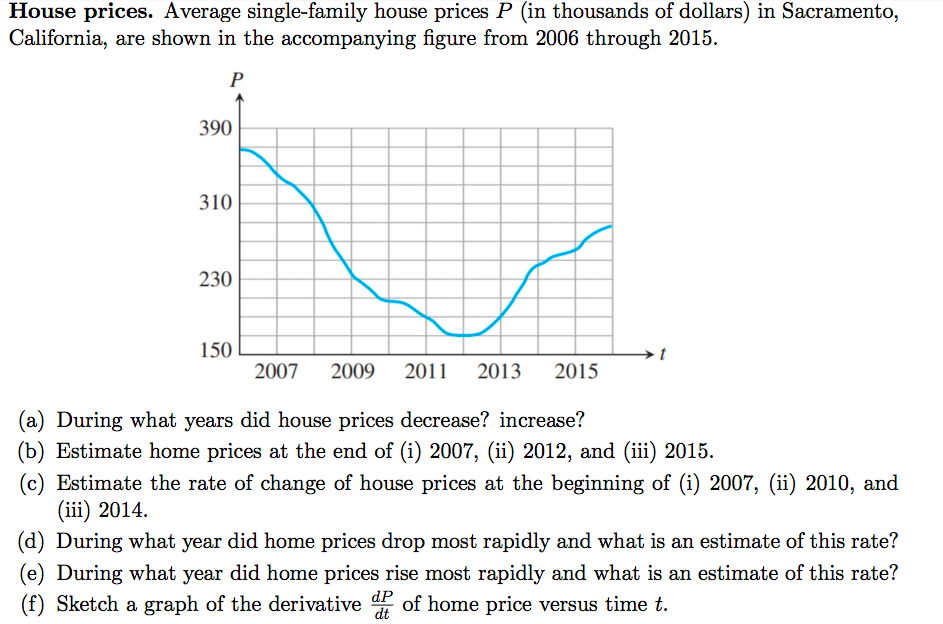
Temperature. The given graph shows the outside temperature T in D'F, between 6am and 7pm. E"? E E E E [ D 3 6 9 12 6 AM. 9 AM. 12 NOON 3 RM. 6 PM. Time (hr) (a) Estimate the rate of temperature change at the times {1) Term, (ii) 9am, (iii) 2pm, and (iv) 4pm. (b) At what time does the temperature increase most rapidly? DecreaSe most rapidly? What is the rate for each of those times? dT ((1) Sketch a graph of the derivative E of temperature against time t. House prices. Average single-family house prices P (in thousands of dollars) in Sacramento, California, are shown in the accompanying gure from 2005 through 2015. 2007 2009 2011 2013 2015 (a) During what years did house prices decrease? increase? (b) Estimate home prices at the end of (i) 2007, (ii) 2012, and (iii) 2015. (c) Estimate the rate of change of house prices at the beginning of (i) 2007, (ii) 2010, and (iii) 2014. ((1) During what year did home prices drop most rapidly and what is an estimate of this rate? (e) During what year did home prices rise most rapidly and what is an estimate of this rate? (1') Sketch a graph of the derivative % of home price versus time t
Step by Step Solution
There are 3 Steps involved in it

Get step-by-step solutions from verified subject matter experts