

Given the band pass signal spectrum shown in Figure 2.42, sketch spectra for the following sampling rates
Question:
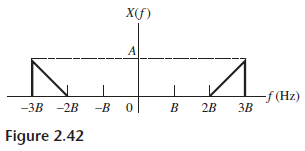 (a) 2B (b) 2.5B (c) 3B (d) 4B (e) 5B (f) 6B
Fantastic news! We've Found the answer you've been seeking!
Step by Step Answer:
For band pass sampling and recovery all but b ...View the full answer

Answered By
Issa Shikuku
I have vast experience of four years in academic and content writing with quality understanding of APA, MLA, Harvard and Chicago formats. I am a dedicated tutor willing to hep prepare outlines, drafts or find sources in every way possible. I strive to make sure my clients follow assignment instructions and meet the rubric criteria by undertaking extensive research to develop perfect drafts and outlines. I do this by ensuring that i am always punctual and deliver quality work.
6+ Reviews
13+ Question Solved
Related Book For 
Principles of Communications Systems, Modulation and Noise
ISBN: 978-8126556793
7th edition
Authors: Rodger E. Ziemer, William H. Tranter
Question Posted:
