

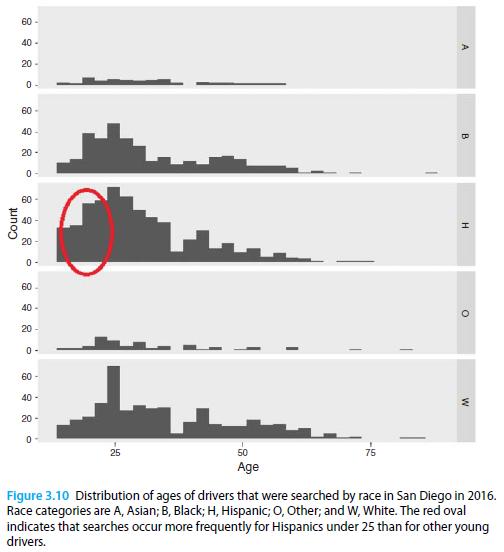
Figure 3.10 shows age histograms by drivers race for moving violation stops in San Diego involving a
Question:
Figure 3.10 shows age histograms by driver’s race for moving violation stops in San Diego involving a search. The figure below displays the age histograms by driver’s race for moving violation stops in San Diego that do not involve a search. How do the distributions per driver’s race compare? Any differences from Figure 3.10?
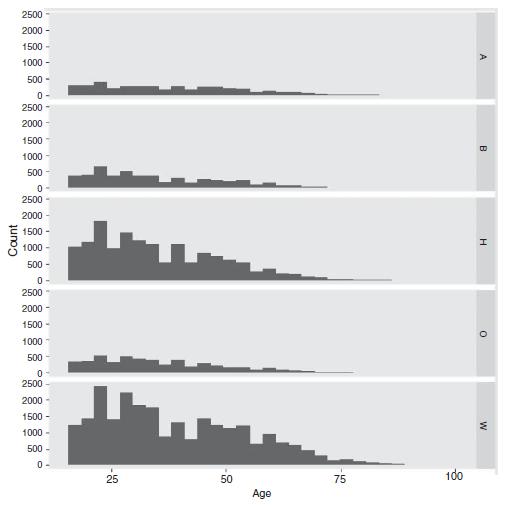
Figure 3.10
Fantastic news! We've Found the answer you've been seeking!
Step by Step Answer:

Answered By
Krishnavendra Y
I am a self motivated financial professional knowledgeable in; preparation of financial reports, reconciling and managing accounts, maintaining cash flows, budgets, among other financial reports. I possess strong analytical skills with high attention to detail and accuracy. I am able to act quickly and effectively when dealing with challenging situations. I have the ability to form positive relationships with colleagues and I believe that team work is great key to performance. I always deliver quality, detailed, original (0% plagiarism), well-researched and critically analyzed papers.
4+ Reviews
10+ Question Solved
Related Book For 

Principles Of Managerial Statistics And Data Science
ISBN: 9781119486411
1st Edition
Authors: Roberto Rivera
Question Posted:
