Calculate the percentage change in the 65-and-over population between 2011 and 2016 for both sexes, males, and
Question:
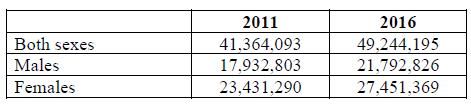
Calculate the percentage change in the 65-and-over population between 2011 and 2016 for both sexes, males, and females.
As marketers focus on millennials embarking on major first-time consumption decisions related to careers, homes, and families, another generation should not be forgotten: the aging baby boomers. The U.S. 65-and-older population will increase to almost 100 million people by 2060. One reason for this trend is the sheer size of the cohort to begin with—72 million people born between 1946 and 1964. Another major factor is that Americans are living longer. In 1950, the average life span was 68 years but is now 78.7 years. And the life-span gap between men and women is decreasing because of reduced smoking rates among men. In addition to longer life spans, families are spreading out—as children embark on careers and start their own families they are no longer staying close to their hometowns. These factors contribute to a greater need for caregiver support for the elderly. There is already a proliferation of services such as “Visiting Angels” and “A Place for Mom.” The number of boomers needing nursing home care could increase 75 percent by 2030 and the number of people with Alzheimer’s disease could triple by 2050. The chart below shows the population estimates for the 65-and-over population for 2011 and 2016, the latest years for which data are available:
Step by Step Answer:
So change change changeBoth changeMales changeFema...View the full answer