

Question: Fig. E7.12 presents the response of a system to a unit step in the input. (a) Use these data to derive an FOPTD model of
(a) Use these data to derive an FOPTD model of this system.
(b) Plot the response of the model and compare with the data.
(c) The FOPTDmodel does not capture all the features of the original response. What is the feature that the FOPTD model fails to capture? What causes this dynamic behavior?
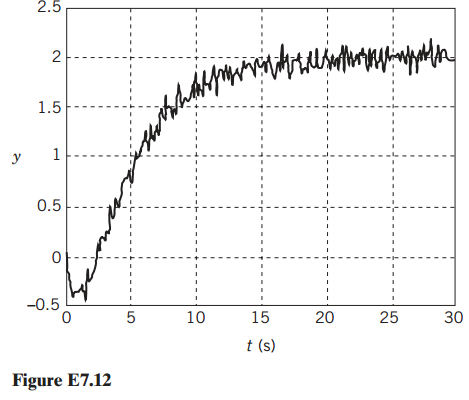
2.5 1.5 0.5 -0.5 10 15 20 25 t (s) Figure E7.12 2.
Step by Step Solution
★★★★★
3.33 Rating (174 Votes )
There are 3 Steps involved in it
1 Expert Approved Answer
Step: 1 Unlock

a For a FOPTD model shown in below Based on visual insp... View full answer
Question Has Been Solved by an Expert!
Get step-by-step solutions from verified subject matter experts
Step: 2 Unlock
Step: 3 Unlock
Document Format (2 attachments)
1602_606321ef1669f_680101.pdf
180 KBs PDF File
1602_606321ef1669f_680101.docx
120 KBs Word File