

Question: Using the information from the following table, create an AON network activity diagram: a. Calculate each activity TE (rounding to the nearest integer), the total
Using the information from the following table, create an AON network activity diagram:
a. Calculate each activity TE (rounding to the nearest integer), the total duration of the project, its early start, early finish, late start, and late finish times, and the slack for each activity. Finally, show the project’s critical path.
b. Now, assume that activity E has taken 10 days past its anticipated duration to complete. What happens to the project’s schedule? Has the duration changed? Is there a new critical path? Show your conclusions.
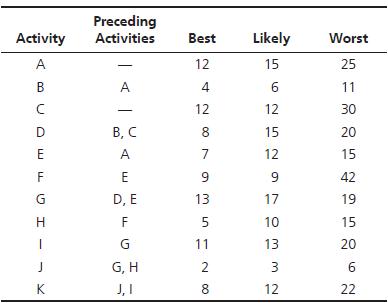
Activity Preceding Activities Best Likely Worst A 12 15 25 BUD A 4 C B, C 28 12 EFGH A 7 E 9 D, E 13 F 5 G 11 62522703 = 11 12 30 15 20 12 15 9 42 17 19 10 15 13 20 J G, H 2 3 6 K J, I 8 12 22
Step by Step Solution
There are 3 Steps involved in it

Get step-by-step solutions from verified subject matter experts