

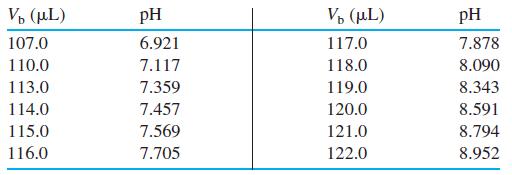
Question: Finding the end point from pH measurements. Here are data points around the second apparent end point in Figure 10-5: (a) Prepare a spreadsheet or
Finding the end point from pH measurements. Here are data points around the second apparent end point in Figure 10-5:
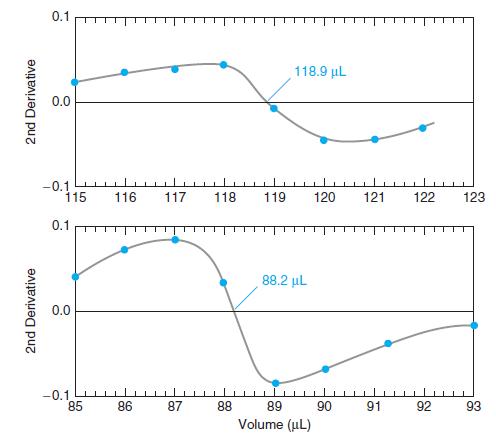
(a) Prepare a spreadsheet or table analogous to Figure 10-6, showing the first and second derivatives. Plot both derivatives versus Vb and locate the end point in each plot.
(b) Prepare a Gran plot analogous to Figure 10-8. Use the leastsquares procedure to find the best straight line and find the end point. You will have to use your judgment as to which points lie on the “straight” line.
Figure 10-5
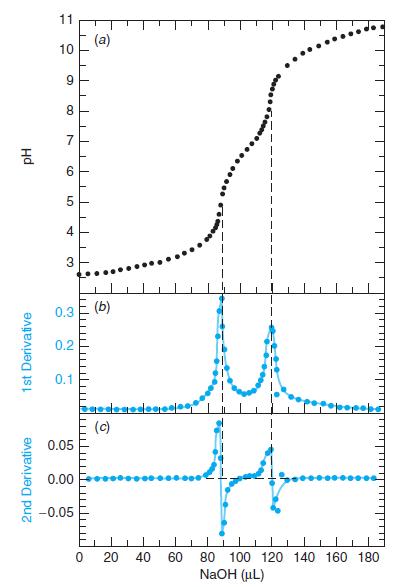
Figure 10-7
V, (L) pH V, (L) pH 107.0 6.921 117.0 7.878 110.0 7.117 118.0 8.090 113.0 7.359 119.0 8.343 114.0 7.457 120.0 8.591 115.0 7.569 121.0 8.794 116.0 7.705 122.0 8.952
Step by Step Solution
3.48 Rating (158 Votes )
There are 3 Steps involved in it

Get step-by-step solutions from verified subject matter experts