

Question: Determine whether the following graph can represent a variable with a normal distribution. Explain your reasoning lithe graph spoors to represent a normal distribution, estimate
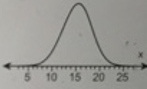
Determine whether the following graph can represent a variable with a normal distribution. Explain your reasoning lithe graph spoors to represent a normal distribution, estimate the mean and standard deviation.
Could the graph represent a variable wall a normal distribution? Explain your reasoning. Select the correct choice below and, If necessary, fill in the
answer boxes within your choice.
A. No, because the graph is skewed right.
B. No, because the graph is skewed left.
C. Yes, the graph fulfills the properties of the normal distribution. The mean is approximately____ and the standard deviation is about___. (Type whole numbers.)
D. No, because the graph crosses the x-axis.
5 10 15 20 25
Step by Step Solution
There are 3 Steps involved in it
The graph shown appears to be bellshaped and symmetric which are key characteristics of a normal dis... View full answer

Get step-by-step solutions from verified subject matter experts