

Question: Determine whether the following graph can represent a variable with a nomal distribution. Explain your reasoning If the graph appears to represent standard deviation
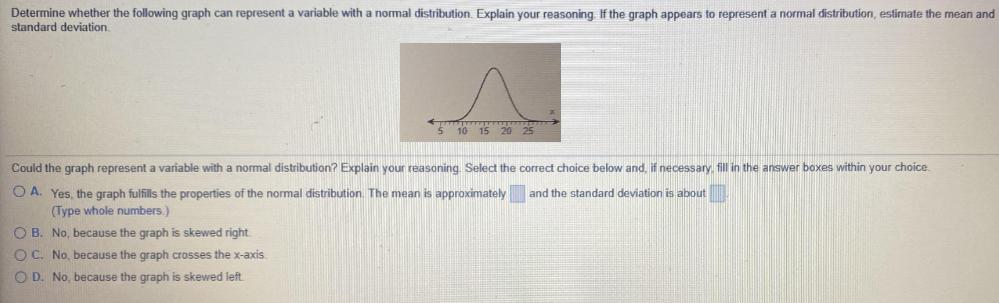
Determine whether the following graph can represent a variable with a nomal distribution. Explain your reasoning If the graph appears to represent standard deviation normal distribution, estimate the mean and 10 15 20 25 Could the graph represent a variable with a normal distribution? Explain your reasoning. Select the correct choice below and, if necessary. fill in the answer boxes within your choice O A. Yes, the graph fulfills the properties of the normal distribution. The mean is approximately (Type whole numbers.) and the standard deviation is about O B. No, because the graph is skewed right O C. No, because the graph crosses the x-axis O D. No, because the graph is skewed left
Step by Step Solution
There are 3 Steps involved in it
To determine if the graph represents a variable with a normal distribution we should look for the fo... View full answer

Get step-by-step solutions from verified subject matter experts