

Jill has taken over a failing service center, with a host of problems that need resolving. Her
Question:
Jill has taken over a failing service center, with a host of problems that need resolving. Her objective is to increase overall customer satisfaction.
She decides to score each problem by the number of complaints that the center has received for each one. (In the table below, the second column shows the problems she has listed in step 1 above, column shows the underlying causes identified in step 2, and the third column shows the number of complaints about each column)
Phones aren't answered quickly enough.
Staff seem distracted and under pressure.
Engineers don't appear to be well organized. They need second visits to bring extra parts.
Engineers don't know what time they'll arrive. This means that customers may have to be in all day for an engineer to visit.
Service center staff doesn?t always seem to know what they're doing.
When engineers visit, the customer finds that the problem could have been solved over the phone.
What is the main issue (problem)?Create an Ishikawa (Cause and Effect) diagram so that the underlying cause for each problem is included (i.e., Phones aren't answered quickly enough: ? Too few service center staff. Remember: If you know why the problem occurred, you can eliminate the reason and prevent the problem from reoccurring)
Create a Pareto chart for the collected data.
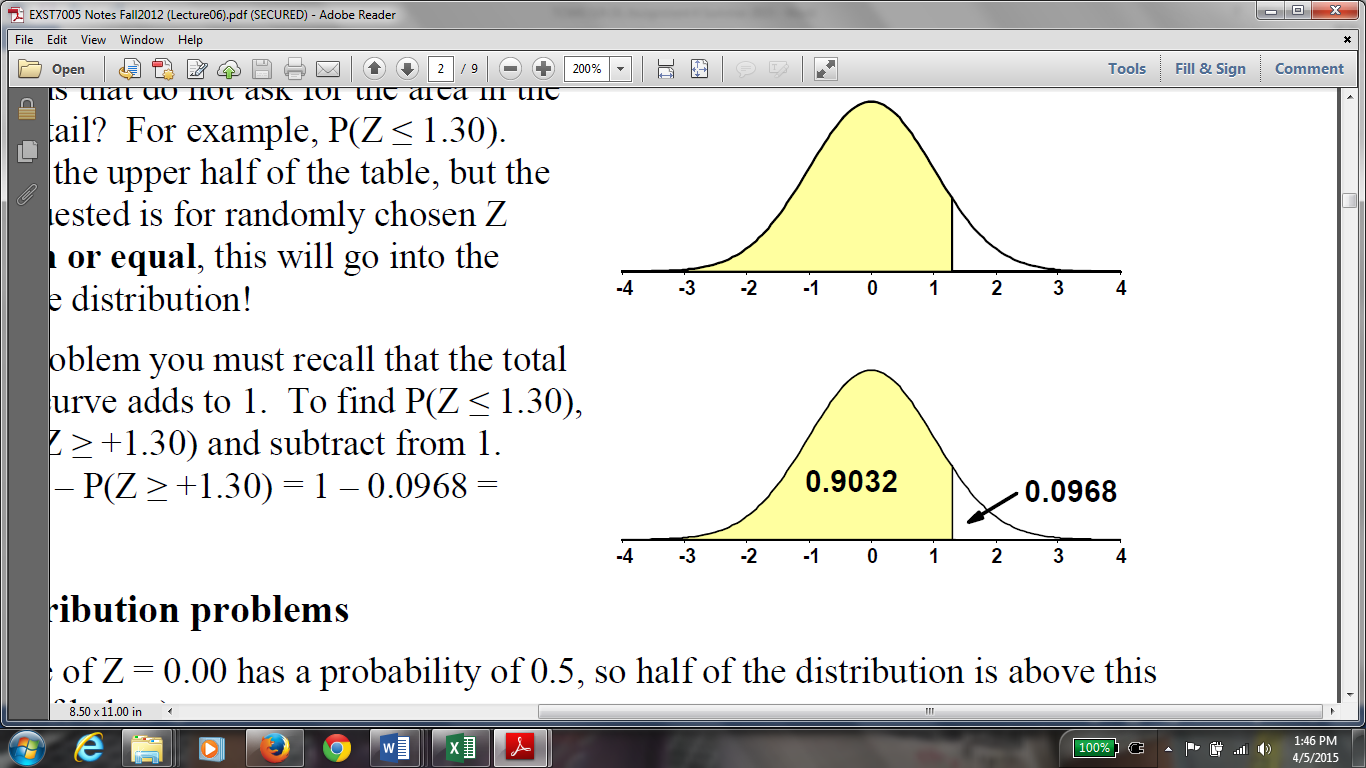
Below distribution indicates that the area under the curve is 90.32%, corresponding to the z-value: 1.30. Is this depiction correct? Why? Why not?
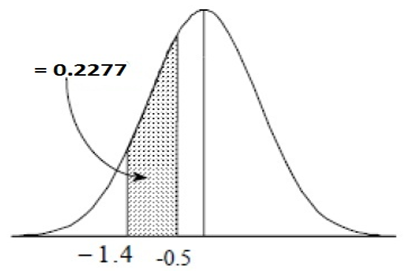
Below distribution indicates that the area under the curve is 22.77%, corresponding to the z-values between -1.4 and -0.5. Is this depiction correct? Why? Why not?
Expert Answer:
Yes the depiction is correct because the area under the curve is about 9032 covered ... View the full answer


Microeconomics
ISBN: 9781464146978
1st edition
Authors: Austan Goolsbee, Steven Levitt, Chad Syverson
