

Question: ( 1 0 points ) The table below shows the available traffic data of a road. What is the most nearly the design ESALs over
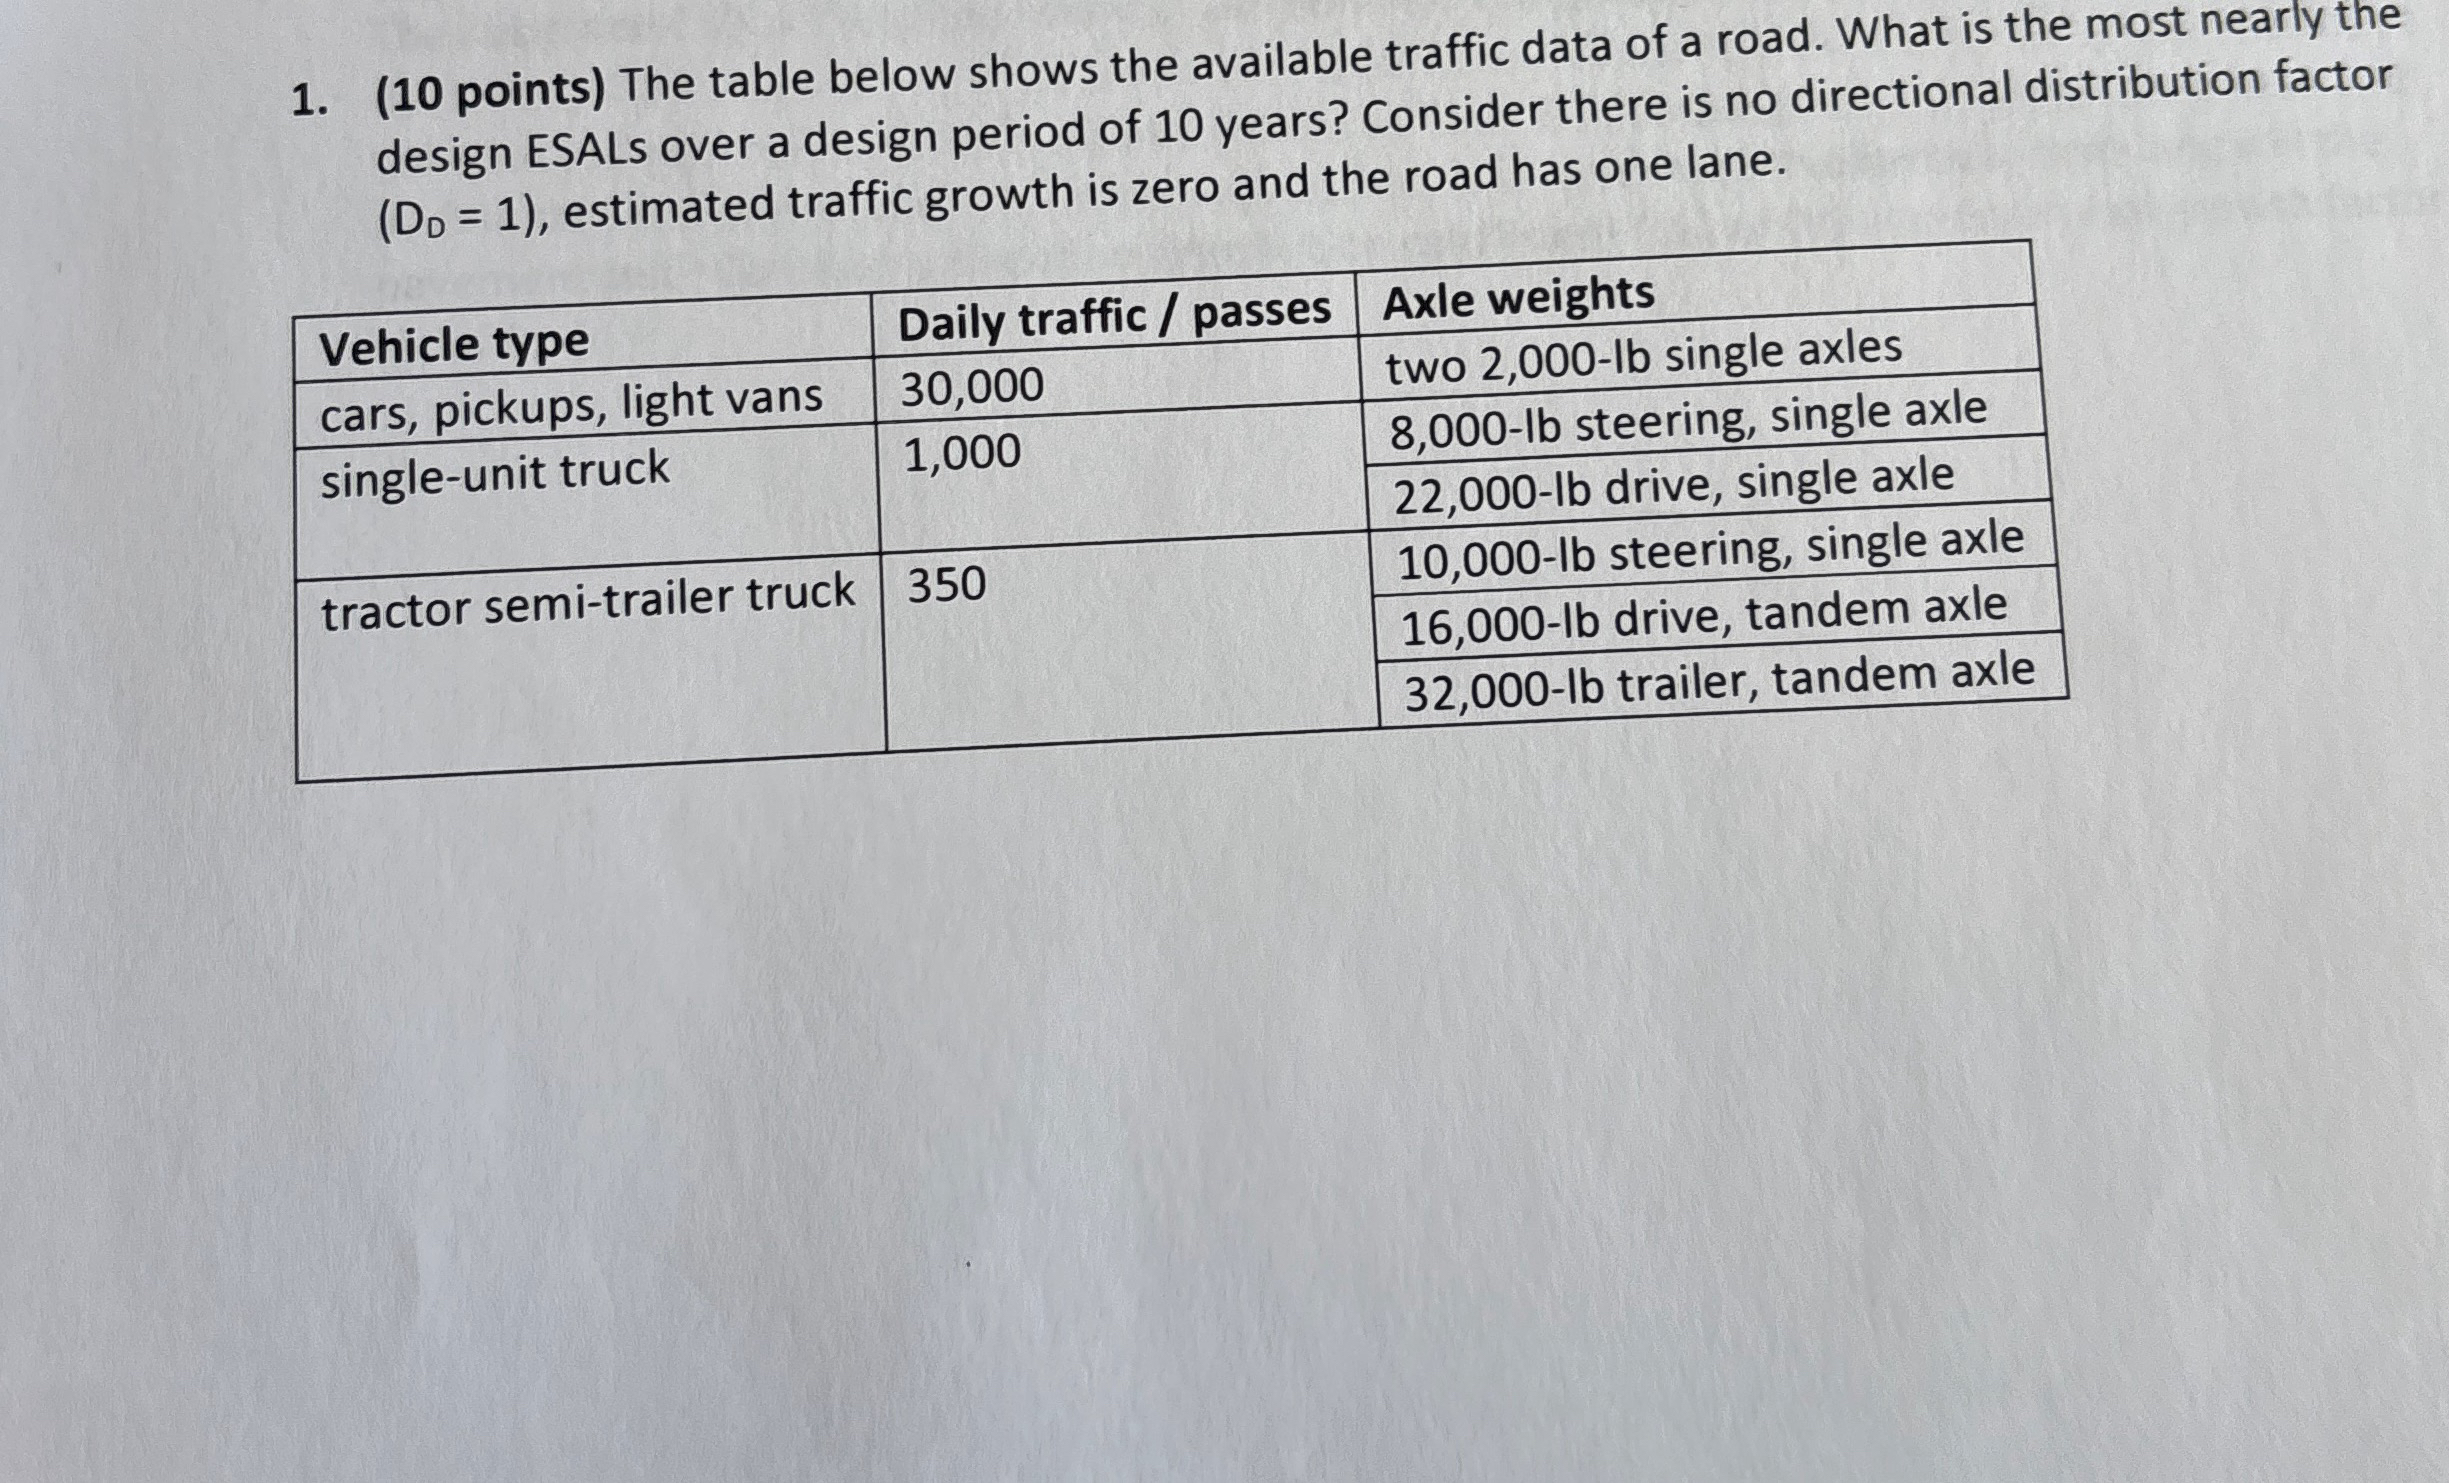
points The table below shows the available traffic data of a road. What is the most nearly the design ESALs over a design period of years? Consider there is no directional distribution factor estimated traffic growth is zero and the road has one lane.
tableDaily traffic passes,Axle weightstableVehicle typecars pickups, light vanstwo lb single axlessingleunit truck,lb steering, single axlelb drive, single axletractor semitrailer truck,lb steering, single axlelb drive, tandem axle lb trailer, tandem axle
Step by Step Solution
There are 3 Steps involved in it
1 Expert Approved Answer
Step: 1 Unlock

Question Has Been Solved by an Expert!
Get step-by-step solutions from verified subject matter experts
Step: 2 Unlock
Step: 3 Unlock