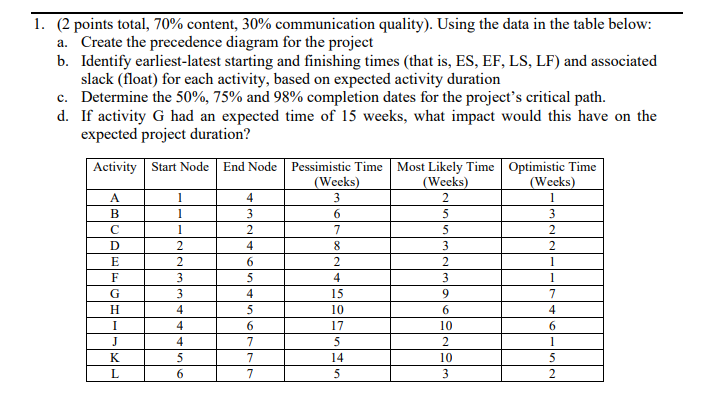
Question: 1. (2 points total, 70% content, 30% communication quality). Using the data in the table below: a. Create the precedence diagram for the project b.

1. (2 points total, 70% content, 30%

1. (2 points total, 70% content, 30% communication quality). Using the data in the table below: a. Create the precedence diagram for the project b. Identify earliest-latest starting and finishing times that is, ES, EF, LS, LF) and associated slack (float) for each activity, based on expected activity duration c. Determine the 50%, 75% and 98% completion dates for the project's critical path. d. If activity G had an expected time of 15 weeks, what impact would this have on the expected project duration? Activity Start Node End Node Pessimistic Time Most Likely Time Optimistic Time (Weeks) (Weeks) (Weeks) A B D E F G H I J K L 2 2 3 3 4 4 4 5 6 4 3 2 4 6 5 4 5 6 3 6 7 8 2 4 15 10 17 5 14 5 2 5 5 3 2 3 9 6 10 2 10 3 1 3 2 2 1 1 7 4 6 1 5 2 7

Step by Step Solution

There are 3 Steps involved in it

1 Expert Approved Answer
Step: 1 Unlock blur-text-image
Question Has Been Solved by an Expert!

Get step-by-step solutions from verified subject matter experts

Step: 2 Unlock
Step: 3 Unlock

Students Have Also Explored These Related General Management Questions!