

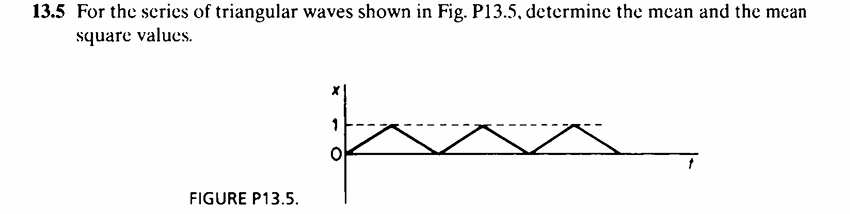
Question: 1 3 . 5 For the series of triangular waves shown in Fig. P 1 3 . 5 , determine the mean and the mean
For the series of triangular waves shown in Fig. P determine the mean and the mean square values.
FIGURE P
give me the mathematical solution not theory
Step by Step Solution
There are 3 Steps involved in it
1 Expert Approved Answer
Step: 1 Unlock

Question Has Been Solved by an Expert!
Get step-by-step solutions from verified subject matter experts
Step: 2 Unlock
Step: 3 Unlock