

Question: 1.. a. Select the graph that represents the yield curve for this date. b. If the expectations hypothesis is true, approximately (ignoring compounding) what rate
1..
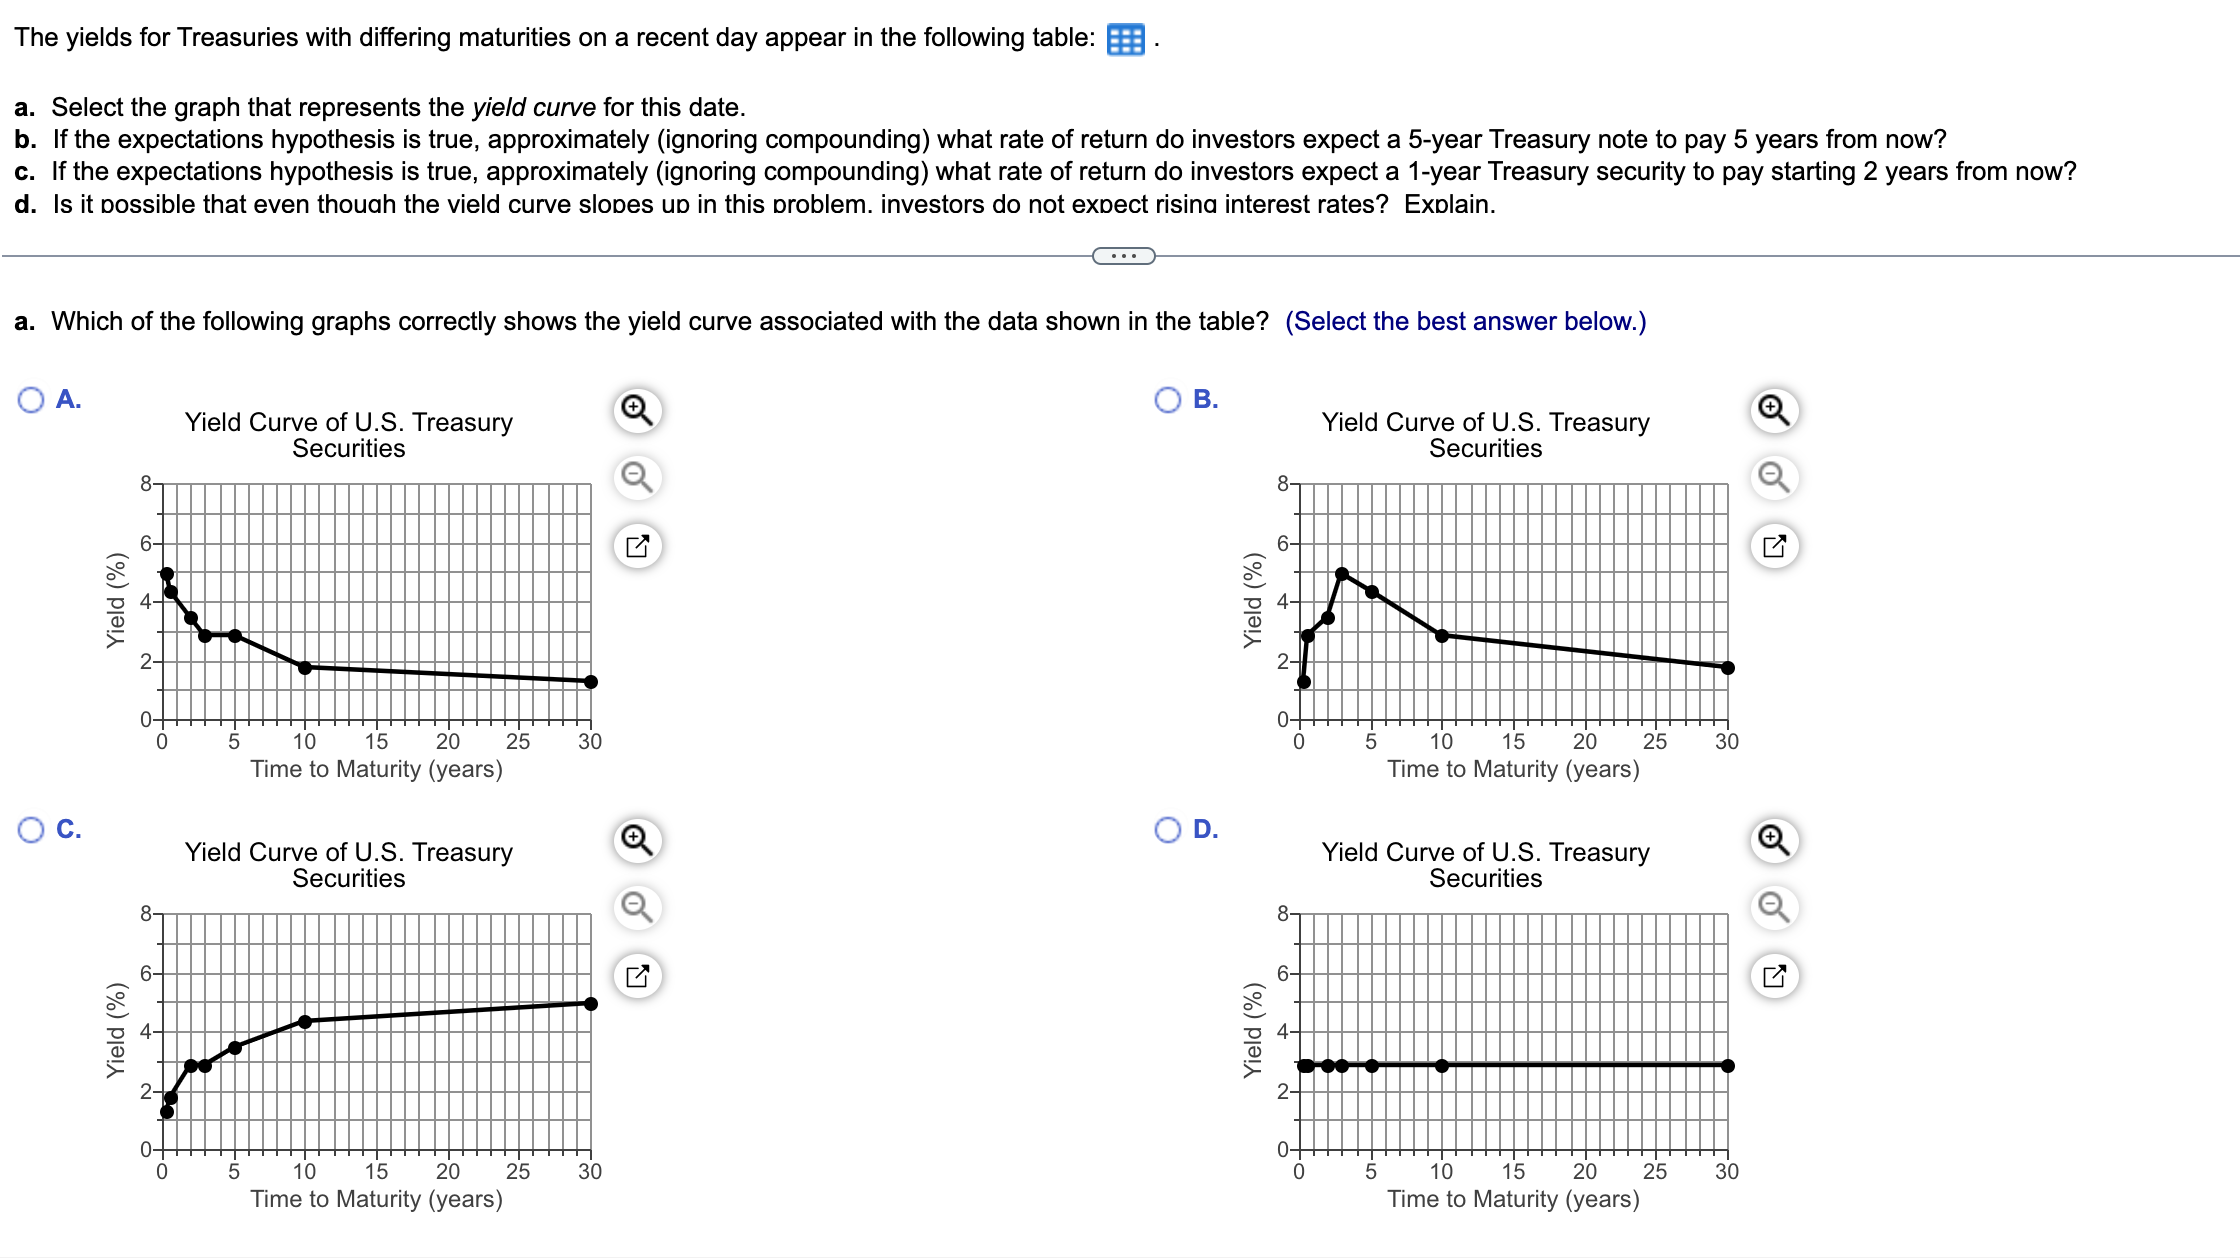
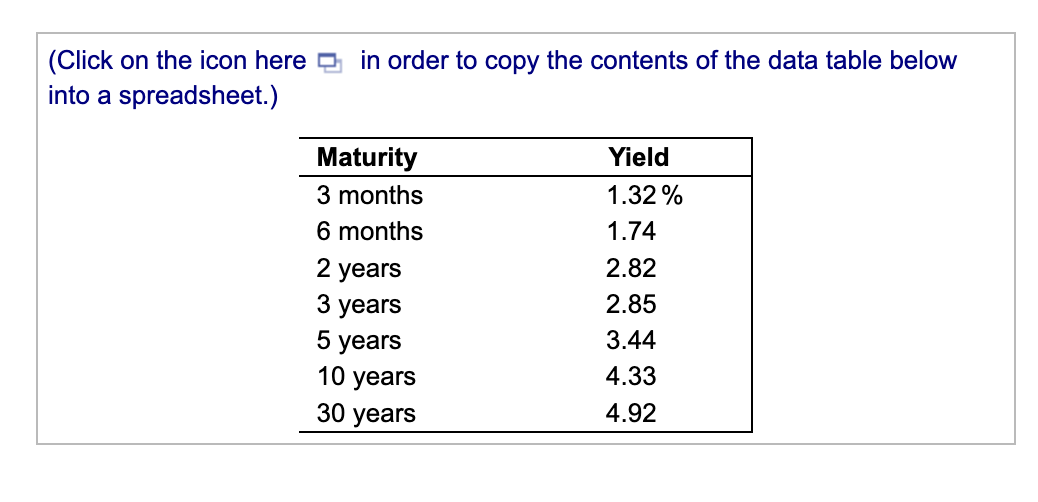
a. Select the graph that represents the yield curve for this date. b. If the expectations hypothesis is true, approximately (ignoring compounding) what rate of return do investors expect a 5-year Treasury note to pay 5 years from now? c. If the expectations hypothesis is true, approximately (ignoring compounding) what rate of return do investors expect a 1-year Treasury security to pay starting 2 years from now? d. Is it possible that even thouah the vield curve slopes un in this problem. investors do not expect risina interest rates? Explain. a. Which of the following graphs correctly shows the yield curve associated with the data shown in the table? (Select the best answer below.) A. Yield Curve of U.S. Treasury B. Yield Curve of U.S. Treasury I Irrle to iviatury (years) c. Yield Curve of U.S. Treasury Iime to Maturity (years) D. Yield Curve of U.S. Treasurv (Click on the icon here in order to copy the contents of the data table below into a spreadsheet.)
Step by Step Solution
There are 3 Steps involved in it

Get step-by-step solutions from verified subject matter experts