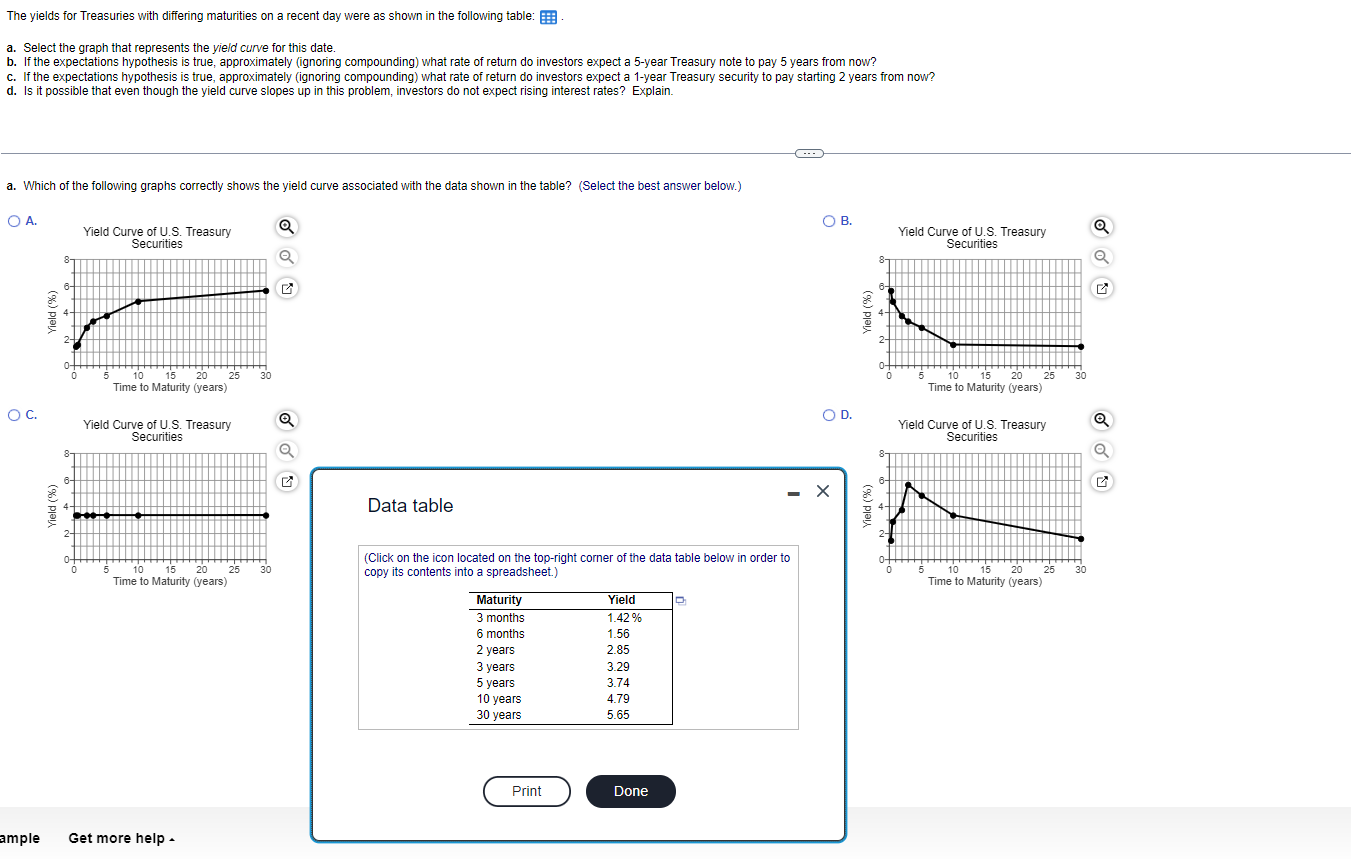
Question: The yields for Treasuries with differing maturities on a recent day were as shown in the following table: ] a. Select the graph that represents

The yields for Treasuries with differing
The yields for Treasuries with differing maturities on a recent day were as shown in the following table: ] a. Select the graph that represents the yield curve for this date. b. If the expectations hypothesis is true, approximately (ignoring compounding) what rate of return do investors expect a 5-year Treasury note to pay 5 years from now? C. If the expectations hypothesis is true, approximately (ignoring compounding) what rate of return do investors expect a 1-year Treasury security to pay starting 2 years from now? d. Is it possible that even though the yield curve slopes up in this problem, investors do not expect rising interest rates? Explain. a. Which of the following graphs correctly shows the yield curve associated with the data shown in the table? (Select the best answer below.) O B. O A. Yield Curve of U.S. Treasury Yield Curve of U.S. Treasury Securities Securities BT Yield (%) Yield (%) N N of 10 20 25 30 20 25 20 Time to Maturity (years) Time to Maturity (years) O D. O C. Yield Curve of U.S. Treasury Yield Curve of U.S. Treasury Securities Securities X Data table Yield (%) Yield (%) N (Click on the icon located on the top-right corner of the data table below in order to 10 15 20 25 5 10 15 20 25 30 copy its contents into a spreadsheet. Time to Maturity (years) Time to Maturity (years) Maturity Yield 3 months 1.42% 6 months 1.56 2 years 2.85 3 years 3.29 5 years 3.74 10 years 4.79 30 years 5.65 Print Done ample Get more help

Step by Step Solution

There are 3 Steps involved in it

1 Expert Approved Answer
Step: 1 Unlock blur-text-image
Question Has Been Solved by an Expert!

Get step-by-step solutions from verified subject matter experts

Step: 2 Unlock
Step: 3 Unlock

Students Have Also Explored These Related Finance Questions!