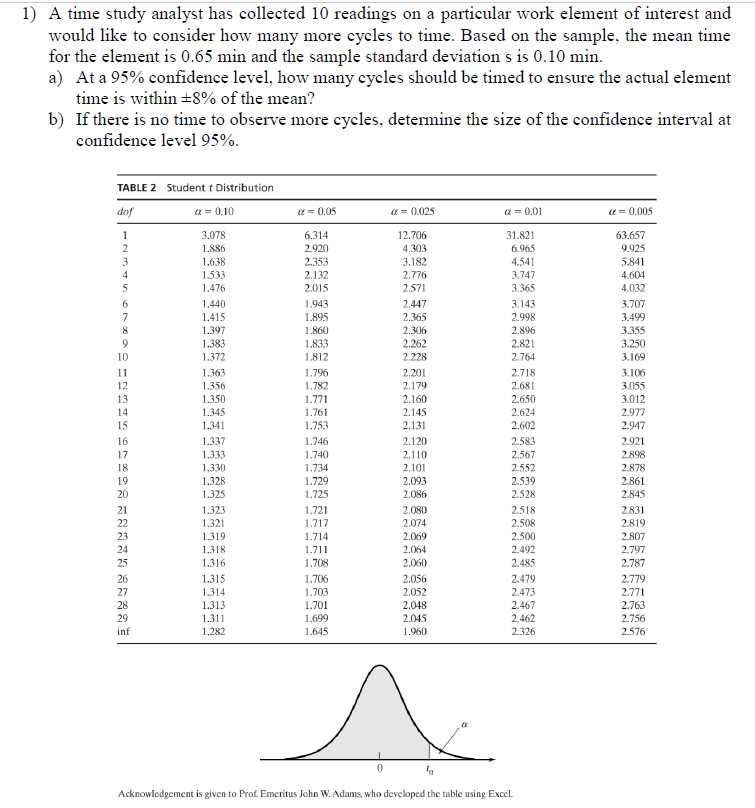
Question: 1) A time study analyst has collected 10 readings on a particular work element of interest and would like to consider how many more cycles

1) A time study analyst has collected 10 readings1) A time study analyst has collected 10 readings1) A time study analyst has collected 10 readings

1) A time study analyst has collected 10 readings on a particular work element of interest and would like to consider how many more cycles to time. Based on the sample, the mean time for the element is 0.65 min and the sample standard deviation s is 0.10 min. a) At a 95% confidence level, how many cycles should be timed to ensure the actual element time is within +8% of the mean? b) If there is no time to observe more cycles, determine the size of the confidence interval at confidence level 95% TABLE 2 Student t Distribution dof a = 0.10 0.05 a = 0.025 = 0.01 G=0.005 1 2 3 4 5 3.078 1.886 1.638 1.533 1.476 6.314 2.920 2.353 2.132 2015 12.706 4.303 3.182 2.776 2.571 31.821 6.965 4.541 3.747 3.365 63.657 9.925 5.841 4.604 4.032 6 7 8 1.943 1.895 1.860 1.833 1.812 2.447 2.365 2.306 2.262 2.228 3.707 3.499 3.355 3.250 3.169 9 10 1.440 1.415 1.397 1.383 1.372 1.363 1.356 1.350 1.345 1.341 3.143 2.998 2.896 2.821 2.764 2.718 2.681 2.650 2.624 2.602 11 2.201 12 13 14 15 1.796 1.782 1.771 1.761 1.753 2.179 2.160 2.145 2.131 3.106 3.055 3.012 2.977 2.947 16 2.120 2.921 2.898 17 2.110 1.337 1.333 1.330 1.328 1.325 2.583 2.567 2.552 18 1.746 1.740 1.734 1.729 1.725 2.101 2.093 2.086 19 20 2.539 2.878 2.861 2.845 2.528 21 22 23 24 1.323 1.321 1.319 1.318 1.316 1.721 1.717 1.714 2.080 2.074 2.069 2.831 2.819 2.807 2.797 2.787 1.711 2.064 25 1.708 2.060 2.518 2.508 2.500 2.492 2.485 2.479 2.473 2.467 2.462 2.326 26 27 28 29 1.315 1.314 1.313 1.311 1.282 1.706 1.703 1.701 1.699 1.645 2.056 2.052 2.048 2.045 1.960 2.779 2.771 2.763 2.756 inf 2576 ^ 0 la Acknowledgement is given to Prof. Emeritus John W. Adams, who developed the table using Excel. c) Given the following from-between chart indicating the flow among 5 departments, you are asked to find placement orders of these departments. A B D E A 32 18 15 10 B 40 12 25 37 0 D 6 E a) Use Planet B method to find a placement order. Show your steps clearly. b) Assume that departments A, B and C are already placed as shown below. Place departments D and E, in that order, to minimize the cost of flow among the departments. Show your steps clearly. (Assume that the distances among potential location are rectilinear e.g. distance between locations 1 and 2 is one unit, 1 and 5 is two units, 1 and 3 is three units.) 21 3 B C5 A 4 c) (Bonus) Calculate the adjacency score of the following layout, given the closeness ratings among departments. ((A = 4, E = 3, I= 2,0 = 1, U = 0, X = -5) B E D A B D E | I I 0 A O E CMUA A X U E

Step by Step Solution

There are 3 Steps involved in it

1 Expert Approved Answer
Step: 1 Unlock blur-text-image
Question Has Been Solved by an Expert!

Get step-by-step solutions from verified subject matter experts

Step: 2 Unlock
Step: 3 Unlock

Students Have Also Explored These Related General Management Questions!