

Question: 1. Calculate the potential enrollment for fall 2017 using a three-semester weighted moving average, with weights 0.1, 0.3, and 0.6, with 0.06 for the most


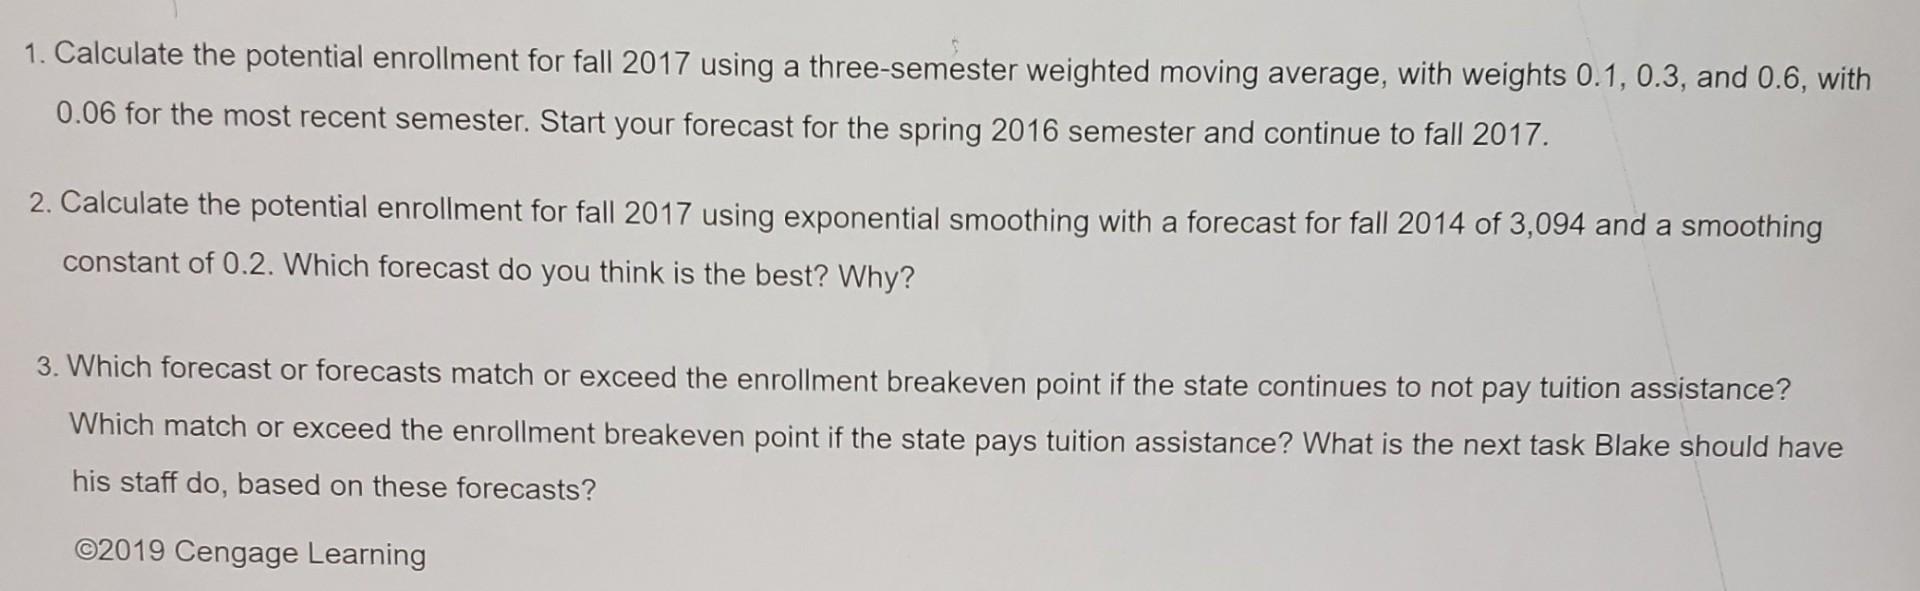

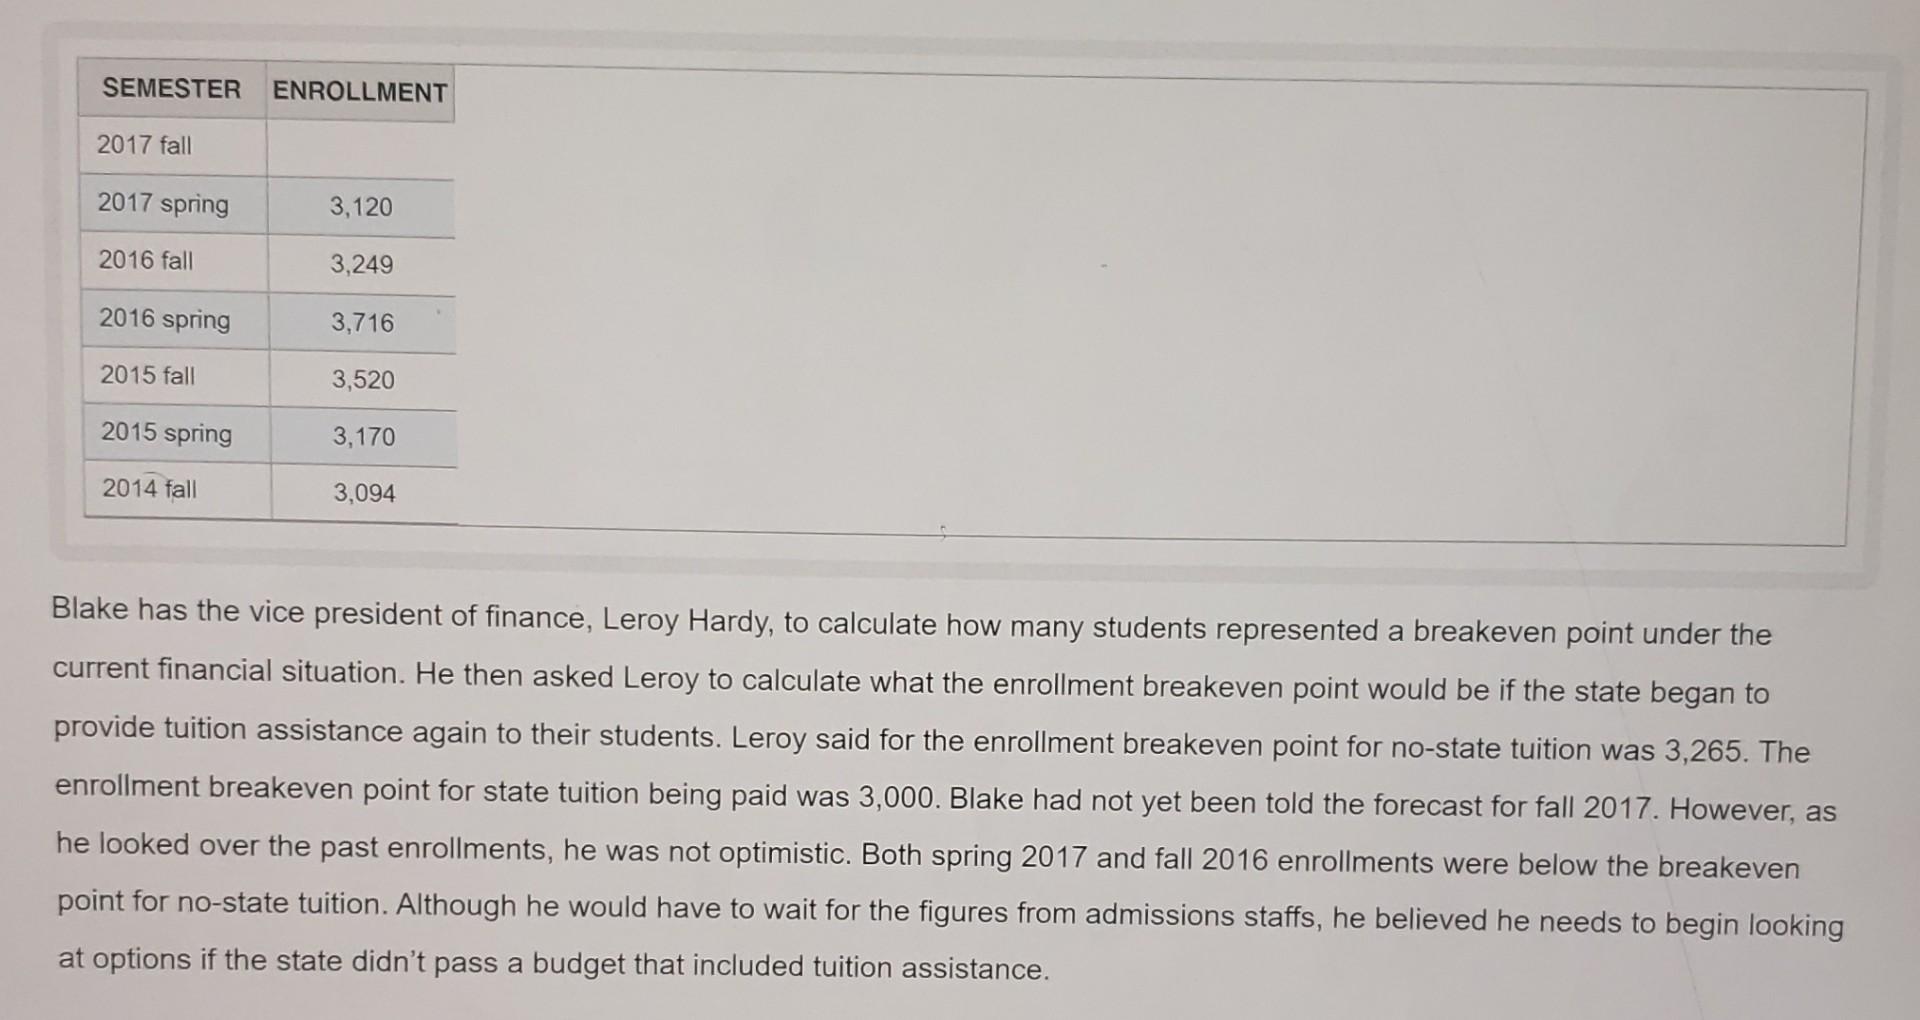
1. Calculate the potential enrollment for fall 2017 using a three-semester weighted moving average, with weights 0.1, 0.3, and 0.6, with 0.06 for the most recent semester. Start your forecast for the spring 2016 semester and continue to fall 2017. 2. Calculate the potential enrollment for fall 2017 using exponential smoothing with a forecast for fall 2014 of 3,094 and a smoothing constant of 0.2. Which forecast do you think is the best? Why? a 3. Which forecast or forecasts match or exceed the enrollment breakeven point if the state continues to not pay tuition assistance? Which match or exceed the enrollment breakeven point if the state pays tuition assistance? What is the next task Blake should have his staff do, based on these forecasts? 2019 Cengage Learning 1. Calculate the potential enrollment for fall 2017 using a three-semester weighted moving average, with weights 0.1, 0.3, and 0.6, with 0.06 for the most recent semester. Start your forecast for the spring 2016 semester and continue to fall 2017. 2. Calculate the potential enrollment for fall 2017 using exponential smoothing with a forecast for fall 2014 of 3,094 and a smoothing constant of 0.2. Which forecast do you think is the best? Why? a 3. Which forecast or forecasts match or exceed the enrollment breakeven point if the state continues to not pay tuition assistance? Which match or exceed the enrollment breakeven point if the state pays tuition assistance? What is the next task Blake should have his staff do, based on these forecasts? 2019 Cengage Learning 1. Calculate the potential enrollment for fall 2017 using a three-semester weighted moving average, with weights 0.1, 0.3, and 0.6, with 0.06 for the most recent semester. Start your forecast for the spring 2016 semester and continue to fall 2017. 2. Calculate the potential enrollment for fall 2017 using exponential smoothing with a forecast for fall 2014 of 3,094 and a smoothing constant of 0.2. Which forecast do you think is the best? Why? a 3. Which forecast or forecasts match or exceed the enrollment breakeven point if the state continues to not pay tuition assistance? Which match or exceed the enrollment breakeven point if the state pays tuition assistance? What is the next task Blake should have his staff do, based on these forecasts? 2019 Cengage Learning SEMESTER ENROLLMENT 2017 fall 2017 spring 3,120 2016 fall 3,249 2016 spring 3,716 2015 fall 3,520 2015 spring 3,170 2014 fall 3,094 Blake has the vice president of finance, Leroy Hardy, to calculate how many students represented a breakeven point under the current financial situation. He then asked Leroy to calculate what the enrollment breakeven point would be if the state began to provide tuition assistance again to their students. Leroy said for the enrollment breakeven point for no-state tuition was 3,265. The enrollment breakeven point for state tuition being paid was 3,000. Blake had not yet been told the forecast for fall 2017. However, as he looked over the past enrollments, he was not optimistic. Both spring 2017 and fall 2016 enrollments were below the breakeven point for no-state tuition. Although he would have to wait for the figures from admissions staffs, he believed he needs to begin looking at options if the state didn't pass a budget that included tuition assistance
Step by Step Solution
There are 3 Steps involved in it
1 Expert Approved Answer
Step: 1 Unlock

Question Has Been Solved by an Expert!
Get step-by-step solutions from verified subject matter experts
Step: 2 Unlock
Step: 3 Unlock