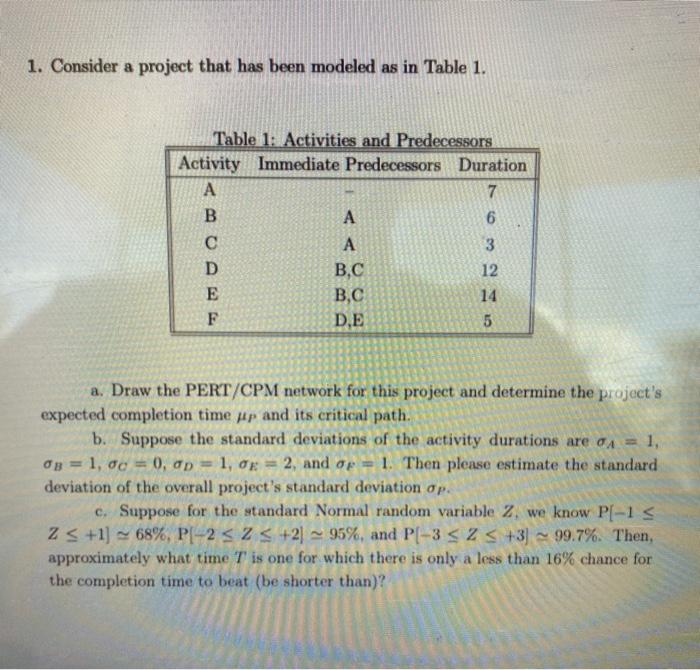
Question: 1. Consider a project that has been modeled as in Table 1. Table 1: Activities and Predecessors Activity Immediate Predecessors Duration A 7 B A

1. Consider a project that has been modeled as in
1. Consider a project that has been modeled as in Table 1. Table 1: Activities and Predecessors Activity Immediate Predecessors Duration A 7 B A 6 3 D B,C 12 E B,C 14 F DE 5 a. Draw the PERT/CPM network for this project and determine the project's expected completion time up and its critical path. b. Suppose the standard deviations of the activity durations are a = 1, B 1, 0, op = 1,08 = 2, and de 1. Then please estimate the standard deviation of the overall project's standard deviation op. c. Suppose for the standard Normal random variable 2, we know P[-13 ZS +1) 68%, PI-2 323 +21 - 95%, and PC-3 S2 S +3] 99.7%. Then, approximately what time T is one for which there is only a less than 16% chance for the completion time to beat (be shorter than)

Step by Step Solution

There are 3 Steps involved in it

1 Expert Approved Answer
Step: 1 Unlock blur-text-image
Question Has Been Solved by an Expert!

Get step-by-step solutions from verified subject matter experts

Step: 2 Unlock
Step: 3 Unlock

Students Have Also Explored These Related General Management Questions!