

Question: 1. Create a new Script file run simple plot.m' 2. Make sure to clear all variables and close all figure windows 3. Create a linearly
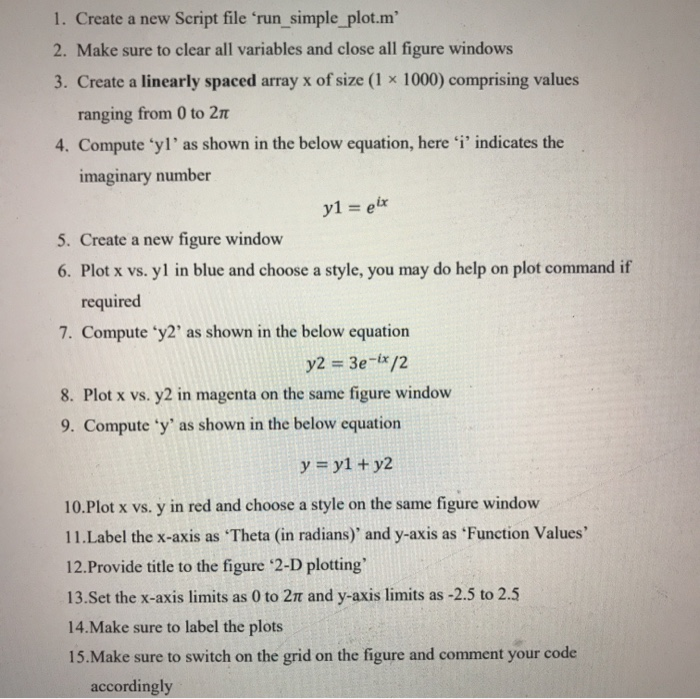
1. Create a new Script file run simple plot.m' 2. Make sure to clear all variables and close all figure windows 3. Create a linearly spaced array x of size (1 x 1000) comprising values ranging from 0 to 211 4. Compute yl'as shown in the below equation, here 'i' indicates the imaginary number y1 = eix 5. Create a new figure window 6. Plot x vs. yl in blue and choose a style, you may do help on plot command if required 7. Compute y2' as shown in the below equation y2 = 3e-ix/2 8. Plot x vs. y2 in magenta on the same figure window 9. Compute 'y' as shown in the below equation y = y1 + y2 10. Plot x vs. y in red and choose a style on the same figure window 11. Label the x-axis as 'Theta (in radians) and y-axis as 'Function Values' 12.Provide title to the figure 2-D plotting 13.Set the x-axis limits as 0 to 21 and y-axis limits as -2.5 to 2.5 14. Make sure to label the plots 15. Make sure to switch on the grid on the figure and comment your code accordingly
Step by Step Solution
There are 3 Steps involved in it

Get step-by-step solutions from verified subject matter experts