

Question: 1. Draw an activity chart and a bar chart showing the project schedule for the data provided in the table. TASK DURATION (DAYS) DEPENDENCIES T1
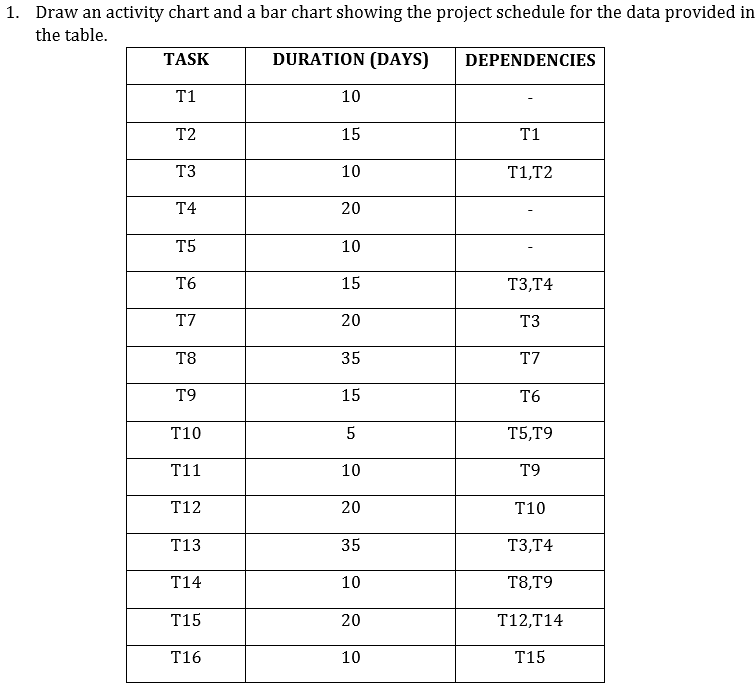
1. Draw an activity chart and a bar chart showing the project schedule for the data provided in the table. TASK DURATION (DAYS) DEPENDENCIES T1 10 T2 T1 T3 10 T1,T2 14 20 T6 15 T3,T4 T7 20 T3 T8 T7 T9 T6 T10 T5,19 T11 T9 T12 T10 T13 T3,T4 T14 10 T8,19 T15 20 T12, T14 T16 10 T15 1. Draw an activity chart and a bar chart showing the project schedule for the data provided in the table. TASK DURATION (DAYS) DEPENDENCIES T1 10 T2 T1 T3 10 T1,T2 14 20 T6 15 T3,T4 T7 20 T3 T8 T7 T9 T6 T10 T5,19 T11 T9 T12 T10 T13 T3,T4 T14 10 T8,19 T15 20 T12, T14 T16 10 T15
Step by Step Solution
There are 3 Steps involved in it
1 Expert Approved Answer
Step: 1 Unlock

Question Has Been Solved by an Expert!
Get step-by-step solutions from verified subject matter experts
Step: 2 Unlock
Step: 3 Unlock