

Question: 1. Draw PERT Chart with earliest and latest start and finish times/activity. Fill in the slack time in the table for each activity. Show the
1. Draw PERT Chart with earliest and latest start and finish times/activity. Fill in the slack time in the table for each activity. Show the slack time for each path for all paths and show Critical Path (CP) and CP time.
- 2. For the project duration, show staffing profile in people, beginning at the earliest time (forward pass) + Totals
- 3. For the project duration, show the staffing profile in people, beginning at the latest time (backward pass)+Totals
- 4. Suggest moving only one activity only to best level staffing requirements (from either Fwd or Bkd Pass). Make sure to give total staffing required and maximum (delta) change in staffing for the duration of the project.
- 5. Which one activity only is best to crash to shorten project time (in some cases two activities might be required to crash). Show the results and the new Critical Path(s) if you crash the one activity
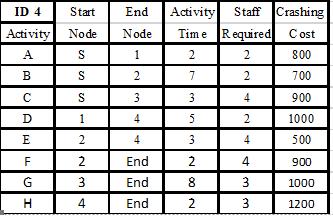
Staff Crashing Activity Time Required Cost ID 4 Start End Activity Node Node A. S 1 2 80 B 7 700 3 4 900 4 1000 E 4 4 500 2 End 2 4 900 End 8 1000 4 End 2 3 1200 2. 2. 2. 2. en 1. 3. LL
Step by Step Solution
★★★★★
3.55 Rating (155 Votes )
There are 3 Steps involved in it
1 Expert Approved Answer
Step: 1 Unlock

LEGEND ES earliest start EF earliest Finis... View full answer
Question Has Been Solved by an Expert!
Get step-by-step solutions from verified subject matter experts
Step: 2 Unlock
Step: 3 Unlock