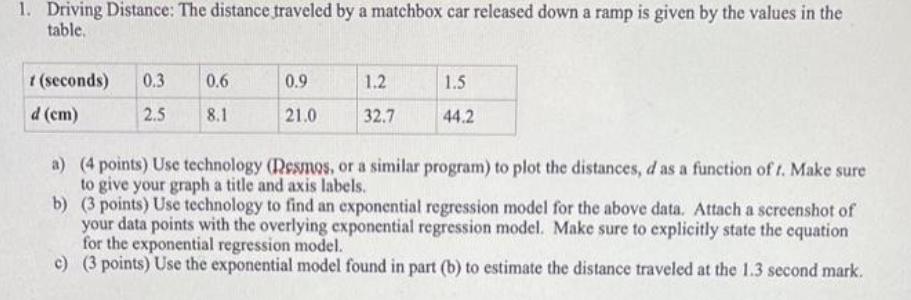
1. Driving Distance: The distance traveled by a matchbox car released down a ramp is given...
Fantastic news! We've Found the answer you've been seeking!
Question:
Transcribed Image Text:
1. Driving Distance: The distance traveled by a matchbox car released down a ramp is given by the values in the table. t (seconds) d (cm) 0.3 2.5 0.6 8.1 0.9 21.0 1.2 32.7 1.5 44.2 a) (4 points) Use technology (Desmos, or a similar program) to plot the distances, d as a function of t. Make sure to give your graph a title and axis labels. b) (3 points) Use technology to find an exponential regression model for the above data. Attach a screenshot of your data points with the overlying exponential regression model. Make sure to explicitly state the equation for the exponential regression model. c) (3 points) Use the exponential model found in part (b) to estimate the distance traveled at the 1.3 second mark. 1. Driving Distance: The distance traveled by a matchbox car released down a ramp is given by the values in the table. t (seconds) d (cm) 0.3 2.5 0.6 8.1 0.9 21.0 1.2 32.7 1.5 44.2 a) (4 points) Use technology (Desmos, or a similar program) to plot the distances, d as a function of t. Make sure to give your graph a title and axis labels. b) (3 points) Use technology to find an exponential regression model for the above data. Attach a screenshot of your data points with the overlying exponential regression model. Make sure to explicitly state the equation for the exponential regression model. c) (3 points) Use the exponential model found in part (b) to estimate the distance traveled at the 1.3 second mark.
Expert Answer:
Answer rating: 100% (QA)
To solve this problem we will first plot the data points given in the table and then use technology ... View the full answer
Related Book For
An Introduction to Statistical Methods and Data Analysis
ISBN: 978-1305269477
7th edition
Authors: R. Lyman Ott, Micheal T. Longnecker
Posted Date:
Students also viewed these accounting questions
-
The distance traveled by a car is given by the values in the table. (a) Use the data to sketch the graph of d as a function of t. (b) Use the graph to estimate the distance traveled after 4.5 seconds.
-
Consider the distance traveled by a golf ball in Exercise 10-33. (a) Use the Wilcoxon rank-sum test to investigate if the means differ. Use = 0.05. (b) Use the normal approximation for the Wilcoxon...
-
Use a graphing calculator with exponential regression capability to model the population of the world with the data from 1950 to 2010 in Table 1 on page 54. Use the model to estimate the population...
-
If a company is very diversified, (a) it makes it easier to classify the company by industry. (b) it would not be necessary to provide any segmented information. (c) it can limit the usefulness of...
-
If legal punishment works as a deterrent, then how does it work? For whom would it work? For whom would it likely not work?
-
One year ago, your company purchased a machine used in manufacturing for $110,000. You have learned that a new machine is available that offers many advantages; you can purchase it for $150,000...
-
A portable concrete test instrument used in construction for evaluating and profiling concrete surfaces (MACRSGDS 5-year property class) is under consideration by a construction firm for \($22,000.\)...
-
Asset Disposal Assume that Gonzalez Company purchased an asset on January 1, 2008, for $60,000. The asset had an estimated life of six years and an estimated residual value of $6,000. The company...
-
What is the half-life in hours of procainamide in a patient whose total clearance is estimated to be 20 L/h and the volume of distribution is 120 L assuming one compartment, open model, first- order...
-
Senior Home Living (SHL) is a Canadian-based corporation located in British Columbia. SHL provides senior living residences across Canada. The company was incorporated in 1975, and has been...
-
Mr. Smart Firm has a portfolio of $7.7 million and beta of 0.74, and required return of 12%. Currently, the real-risk free rate is 3.5% and inflation rate is 1.5%. Mr. Smart Firm will invest another...
-
Q1. (a) With the use of an appropriate diagram, explain how a perfectly competitive firm can incur loss in the short run. (7 marks) (b) Why will a monopoly firm never operate in the inelastic part of...
-
Discuss the application of strategic foresight techniques such as trend analysis, scenario planning, and horizon scanning in informing long-term strategic planning initiatives and fostering a...
-
Can the concept of goal-setting theory provide a comprehensive framework for understanding the multifaceted nature of motivation across diverse domains, including education, work, and personal...
-
Discuss the role of labor in a society. Explain briefly. also discuss What are factors about labor do Coakley & Kates point to in their argument that regulated sweatshop labor is superior to...
-
Describe the process of measuring risks and identify multiple ways an innovating organization can implement risk management practices based on the identification of risk. Examine how technology...
-
Net income of Trout Company was $44,000. The accounting records reveal depreciation expense of $79,000 as well as increases in prepaid rent, salaries payable, and income taxes payable of $59,000,...
-
A liquid flows upward through a valve situated in a vertical pipe. Calculate the differential pressure (kPa) between points A and B. The mean velocity of the flow is 4.1 m/s. The specific gravity of...
-
Refer to Exercise 19.17. Analyze the data using a computer program. Is the analysis of variance table from the output of the computer program the same as your results in Exercise 19.18? In Exercise...
-
Refer to the data of Exercise 3.49. In exercise a. Estimate the interquartile range and the sample standard deviation. b. Which measure of variation would you recommend using as a measure of the...
-
A series of experiments was designed to test a hypothesis that massive silver iodide seeding can, under specified conditions, lead to increased precipitation. The data from these experiments were...
-
What a difference a single outlier can make! The data set in Table 7.7 presents a collection of ordered pairs \((x, y)\). a. Using Minitab, draw a scatterplot and run a simple linear regression...
-
A plant manager wants to estimate how the number of units produced at a plant is affected by the number of employees. The data in Table 7.9 gives a random sample of the number of units produced and...
-
Can the use of social media stress you out? A researcher is interested in finding out whether college students who extensively use social media tend to have higher levels of stress. To test this, a...
Study smarter with the SolutionInn App