

Question: 1. Elden Reyes is an intern with FLO Biotech. Elden is preparing a sales summary, as well as a financial project for a prospective equipment
1. "Elden Reyes is an intern with FLO Biotech. Elden is preparing a sales summary, as well as a financial project for a prospective equipment purchase. He wants to use Excel to create charts to illustrate some of his data and to apply a function to calculate payments. Switch to the Sales by Product worksheet. In the range G7:G18, add column sparklines based on the data in the range B7:F18, and then apply the Green, Accent 6, Darker 25% (10th column, 5th row of the Theme Colors palette) sparkline color."
0/10 Add sparklines to a range. In the Sales by Product worksheet, the sparklines in the range G7:G18 should be formatted as column sparklines. Set the color of a sparkline. In the Sales by Product worksheet, the sparklines in the range G7:G18 should be formatted as column sparklines. 2. Create a Pie chart based on the range F7:F17. Specify the range A7:A17 as the horizontal axis labels. Resize and reposition the chart so that the upper-left corner is located within cell H6 and the lower-right corner is located within cell Q30.
7/10 Insert a chart. Define the legend entries for chart data. In the Sales by Product worksheet, the pie chart's data legend should be based on the values in the range A7:A17. Resize and reposition a chart.
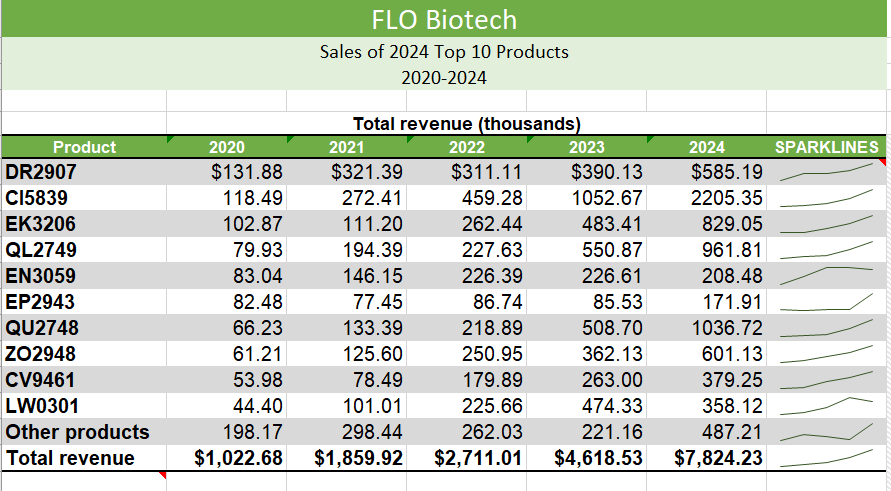
FLO Biotech Sales of 2024 Top 10 Products 2020-2024 FLO Biotech Sales of 2024 Top 10 Products 2020-2024
Step by Step Solution
There are 3 Steps involved in it

Get step-by-step solutions from verified subject matter experts