

Question: 1 . Graphing demand for labour and computing the optimal quantitylr A companyr operates in a perfectly competitive market, selling each unit of output for
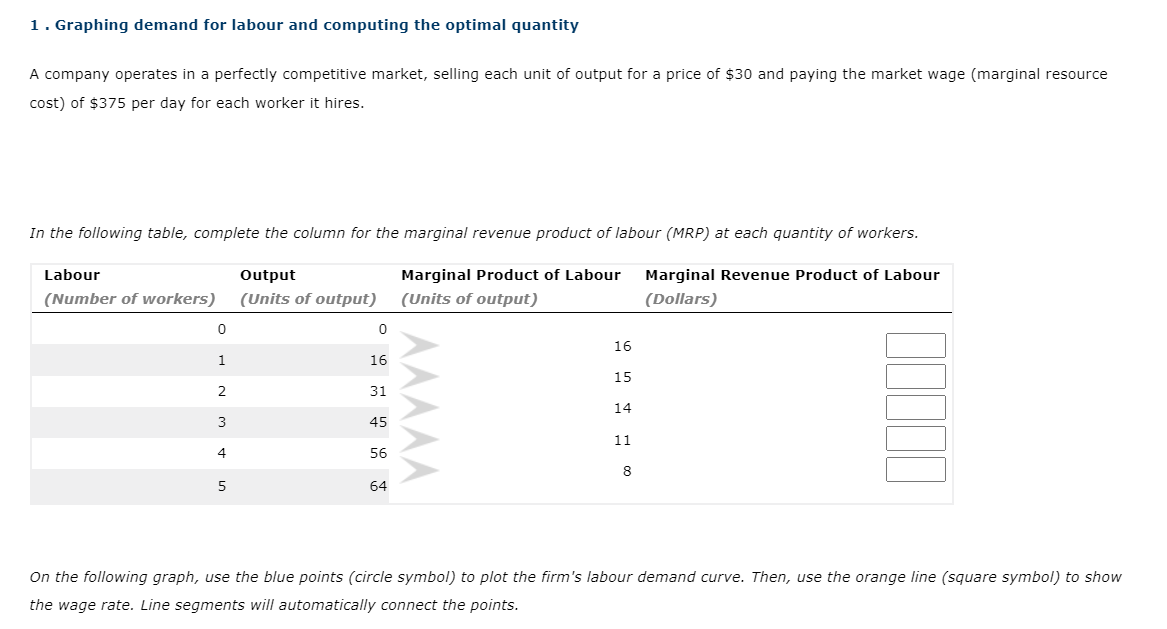
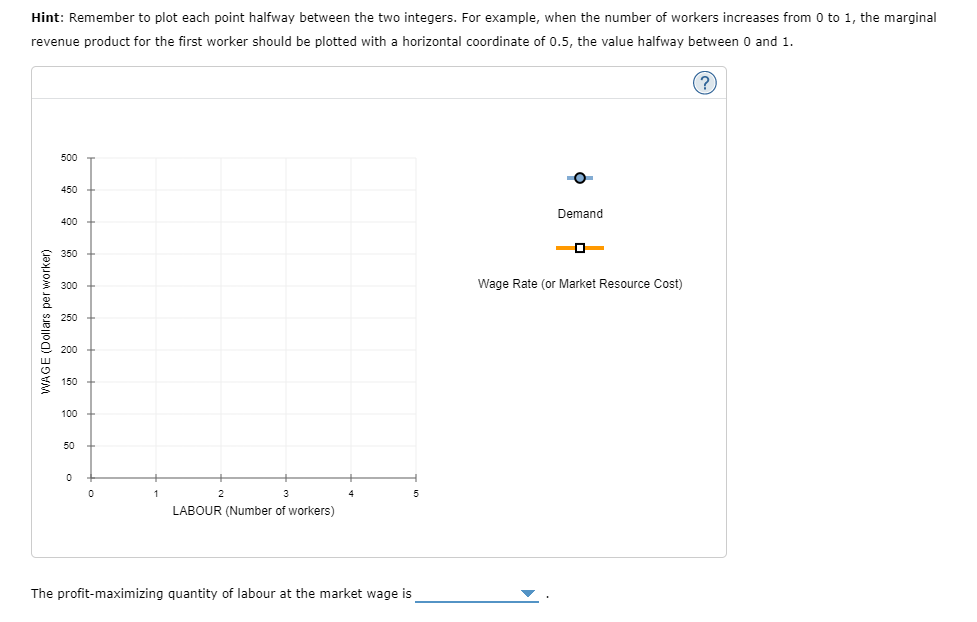
1 . Graphing demand for labour and computing the optimal quantitylr A companyr operates in a perfectly competitive market, selling each unit of output for a price of $30 and paying the market wage {marginal resource cost) of $3?5 per clay.r for each worker it hires. In the following table, complete the column for the marginal revenue product of labour {MRP} at each quantity of workers. Labour Output Marginal Product of Labour Marginal Revenue Product of Labour (Number of workers) (Units of output) (Units of output) (Dollars) 0 0 16 1 15 E 15 E 2 31 14 3 45 4 55 u E 8 5 64 On the following graph, use the blue points (circle symbol) to plot the firm's labour demand curve. Then, use the orange line (square symbol) to show the wage rate. Line segments will automatically connect the points. Hint: Remember to plot each point halfway between the two integers. For example, when the number of workers increases from 0 to 1, the marginal revenue product for the first worker should be plotted with a horizontal coordinate of 0.5, the value halfway between 0 and 1. 500 O 450 Demand 400 350 Wage Rate (or Market Resource Cost) 300 250 WAGE (Dollars per worker) 200 150 100 50 0 2 3 4 LABOUR (Number of workers) The profit-maximizing quantity of labour at the market wage is
Step by Step Solution
There are 3 Steps involved in it

Get step-by-step solutions from verified subject matter experts