

Question: Select the correct mean, median, and mode for the distribution below. 0 5 10 15 20 25 30 35 40 45 a.) mean = 27
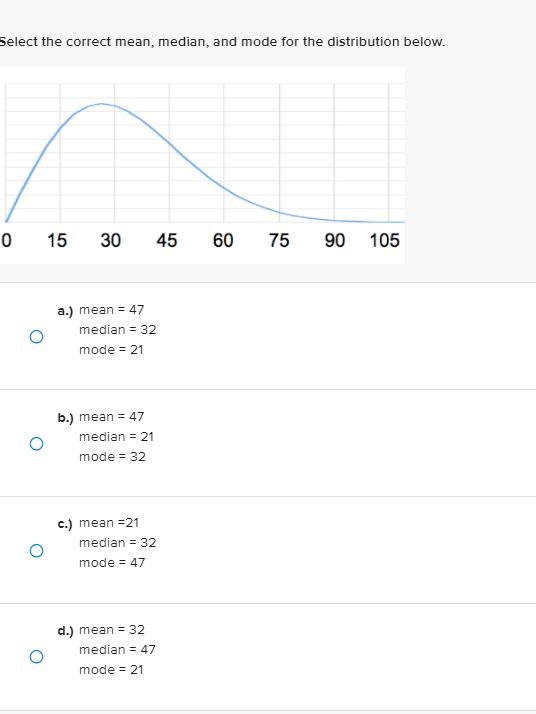
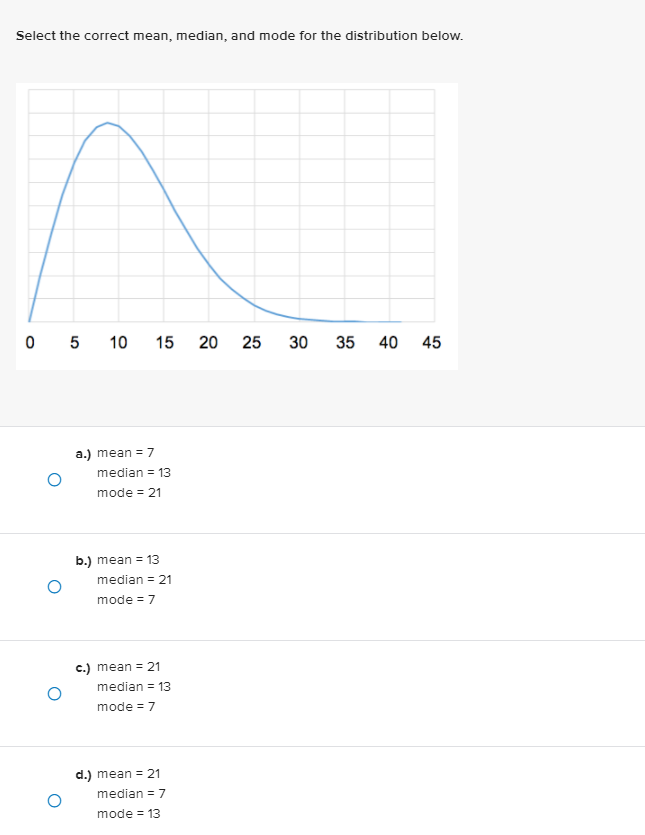
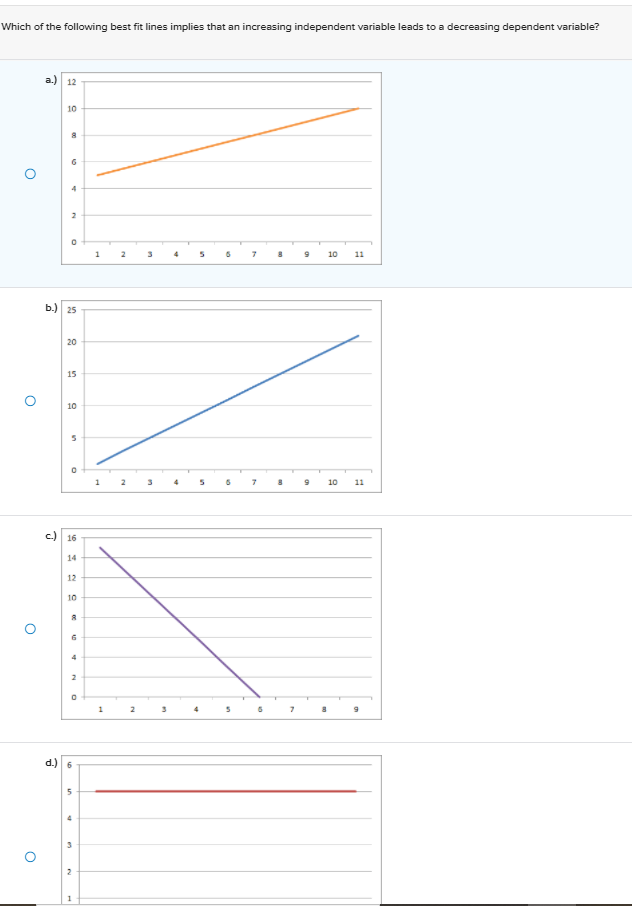

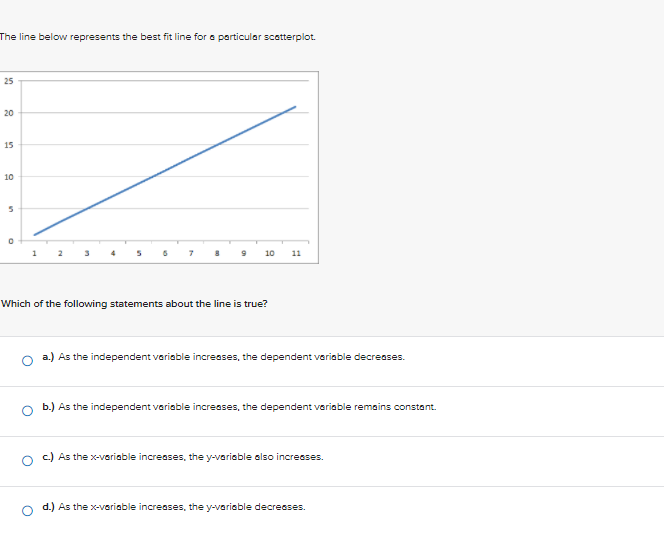
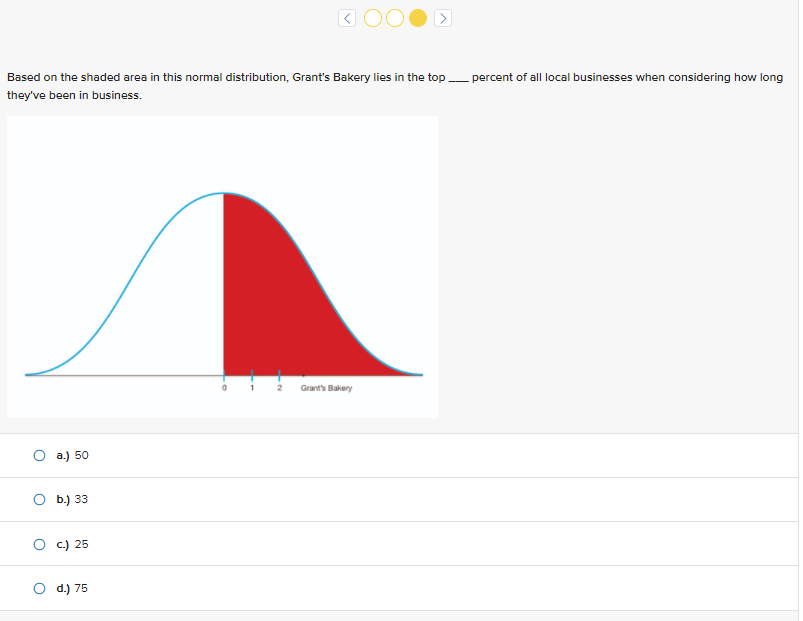
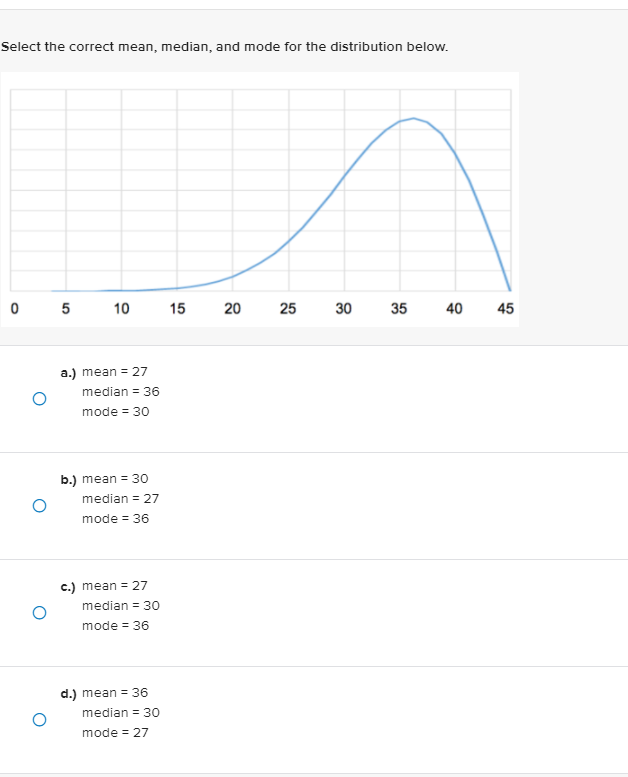


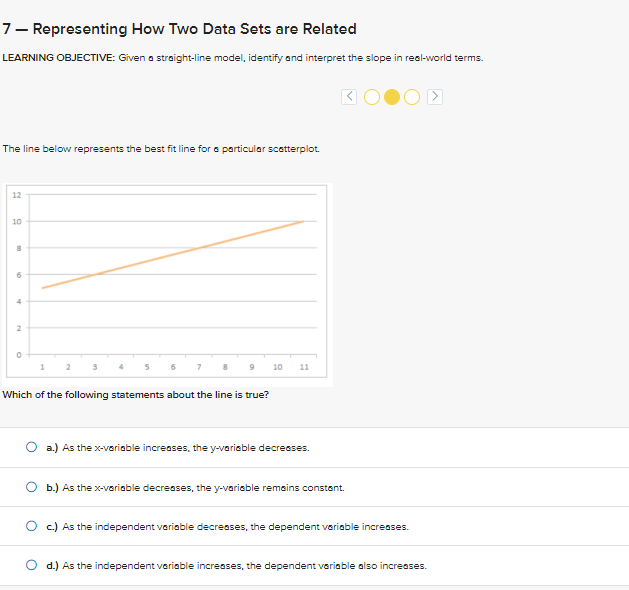


Select the correct mean, median, and mode for the distribution below. 0 5 10 15 20 25 30 35 40 45 a.) mean = 27 O median = 36 mode = 30 b.) mean = 30 O median = 27 mode = 36 c.) mean = 27 O median = 30 mode = 36 d.) mean = 36 O median = 30 mode = 27Select the correct mean, median, and mode for the distribution below. 0 15 30 45 60 75 90 105 a.) mean = 47 O median = 32 mode = 21 b.) mean = 47 O median = 21 mode = 32 IZ= uBaw ('S O median = 32 mode = 47 d.) mean = 32 O median = 47 mode = 21Select the correct mean, median, and mode for the distribution below. 0 5 10 15 20 25 30 35 40 45 a.) mean = 7 O median = 13 mode = 21 b.) mean = 13 O median = 21 mode = 7 c.) mean = 21 O median = 13 mode = 7 d.) mean = 21 O median = 7 mode = 13Which of the following best fit lines implies that an increasing independent variable leads to a decreasing dependent variable? a.) 12 10 O 1 2 7 9 10 11 b.) 25 20 15 O 10 1 2 7 5 10 11 C) 16 14 12 10 O 1 2 d.) 6 un O 27 - Representing How Two Data Sets are Related LEARNING OBJECTIVE: Given a straight-line model, identify and interpret the slope in real-world terms. The line below represents the best fit line for a particular scatterplot. 12 10 3 5 6 7 9 10 11 Which of the following statements about the line is true? a.) As the x-variable increases, the y-variable decreases. O b.) As the x-variable decreases, the y-variable remains constant. O c.) As the independent variable decreases, the dependent variable increases. O d.) As the independent variable increases, the dependent variable also increases.The line below represents the best fit line for a particular scatterplot. 25 20 15 10 1 5 7 9 10 11 Which of the following statements about the line is true? a.) As the independent variable increases, the dependent variable decreases. b.) As the independent variable increases, the dependent variable remains constant. ( () As the x-variable increases, the y-variable also increases. ( d.) As the x-variable increases, the y-variable decreases.OOOD Based on the shaded area in this normal distribution, Grant's Bakery lies in the top __ percent of all local businesses when considering how long they've been in business. Grant's Bakery O a.) 50 O b.) 33 O c.) 25 O d.) 75
Step by Step Solution
There are 3 Steps involved in it

Get step-by-step solutions from verified subject matter experts