

Question: 1. Identify the lower class limits, upper class limits, class width, class midpoints, and class boundaries for the given frequency distribution.Also identify the number of

1. Identify the lower class limits, upper class limits, class width, class midpoints, and class boundaries for the given frequency distribution.Also identify the number of individuals included in the summary Blood Platelet Count ofMales (1000 cells/uL) Frequency 90-991100-19955200-29977300-39921400-4990500-5991600-6990Identify the lower class limits (in 1000 cells/pL).(Type integers or decimals. Do not round. Use ascending order.)2.
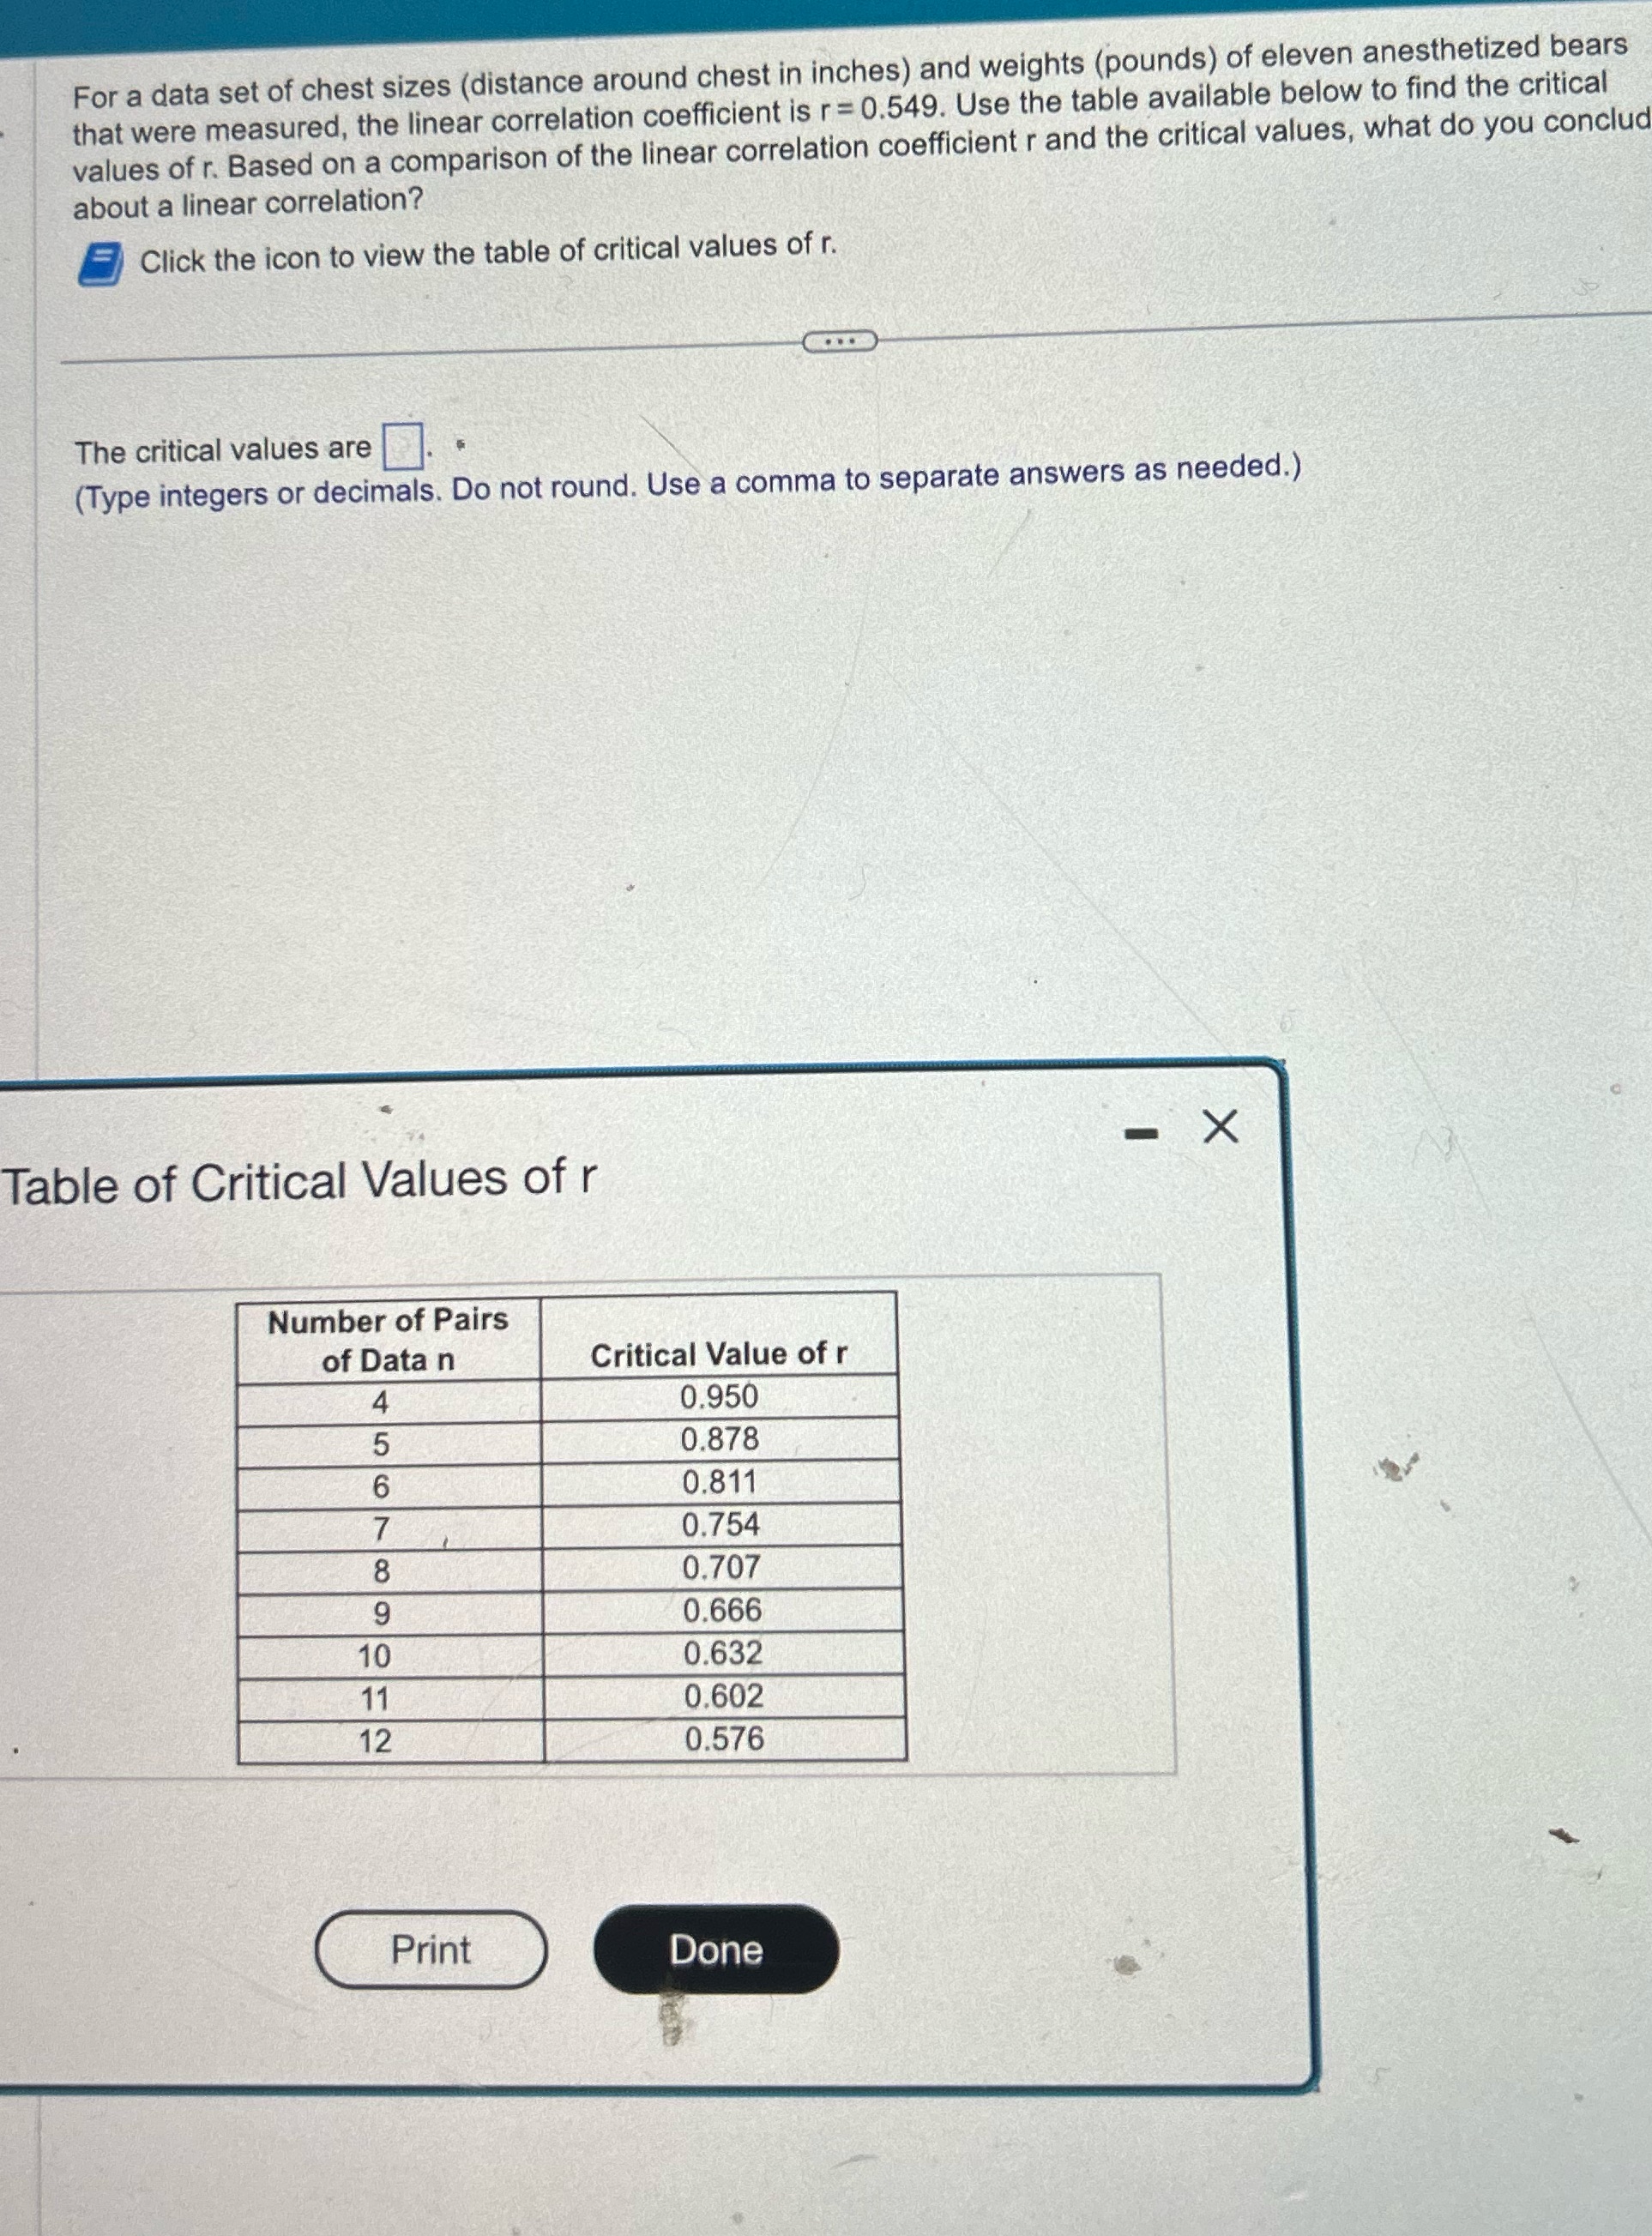
For a data set of chest sizes (distance around chest in inches) and weights (pounds) of eleven anesthetized bears that were measured, the linear correlation coefficient is r= 0.549. Use the table available below to find the critical values of r. Based on a comparison of the linear correlation coefficient r and the critical values, what do you conclud about a linear correlation? Click the icon to view the table of critical values of r. The critical values are. . (Type integers or decimals. Do not round. Use a comma to separate answers as needed.) - X Table of Critical Values of r Number of Pairs of Data n Critical Value of r 4 0.950 5 0.878 6 0.811 7 0.754 8 0.707 9 0.666 10 0.632 0.602 12 0.576 Print Done
Step by Step Solution
There are 3 Steps involved in it

Get step-by-step solutions from verified subject matter experts