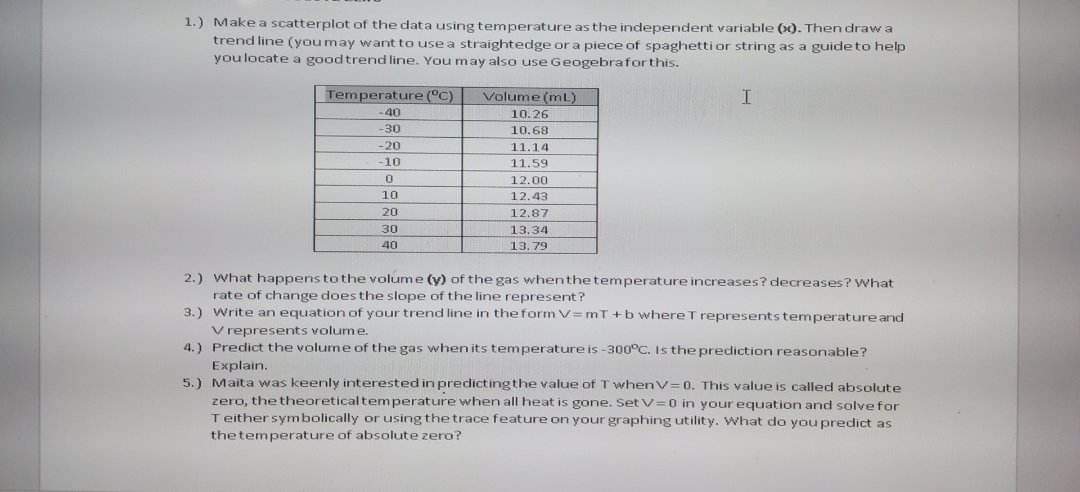
Question: 1.) Make a scatterplot of the data using temperature as the independent variable (0. Then draw a trend line (you may want to use a

1.) Make a scatterplot of the data using
1.) Make a scatterplot of the data using temperature as the independent variable (0. Then draw a trend line (you may want to use a straightedge or a piece of spaghetti or string as a guide to help you locate a good trend line. You may also use Geogebraforthis. Temperature ("c) Volume (mL) I -40 10.26 -30 10.68 -20 11.14 -10 11.59 12.00 10 12.43 20 12.87 30 13.34 40 13. 79 2.) What happens to the volume (y) of the gas when the temperature increases? decreases? What rate of change does the slope of the line represent?' 3.) Write an equation of your trend line in the form V= mT + b where T represents temperature and V represents volume. 4.) Predict the volume of the gas when its temperature is-300"C. Is the prediction reasonable? Explain. 5.) Maita was keenly interested in predicting the value of T when V=0. This value is called absolute zero, the theoretical temperature when all heat is gone. Set V=0 in your equation and solve for T either symbolically or using the trace feature on your graphing utility. What do you predict as the temperature of absolute zero

Step by Step Solution

There are 3 Steps involved in it

1 Expert Approved Answer
Step: 1 Unlock blur-text-image
Question Has Been Solved by an Expert!

Get step-by-step solutions from verified subject matter experts

Step: 2 Unlock
Step: 3 Unlock

Students Have Also Explored These Related Mathematics Questions!