

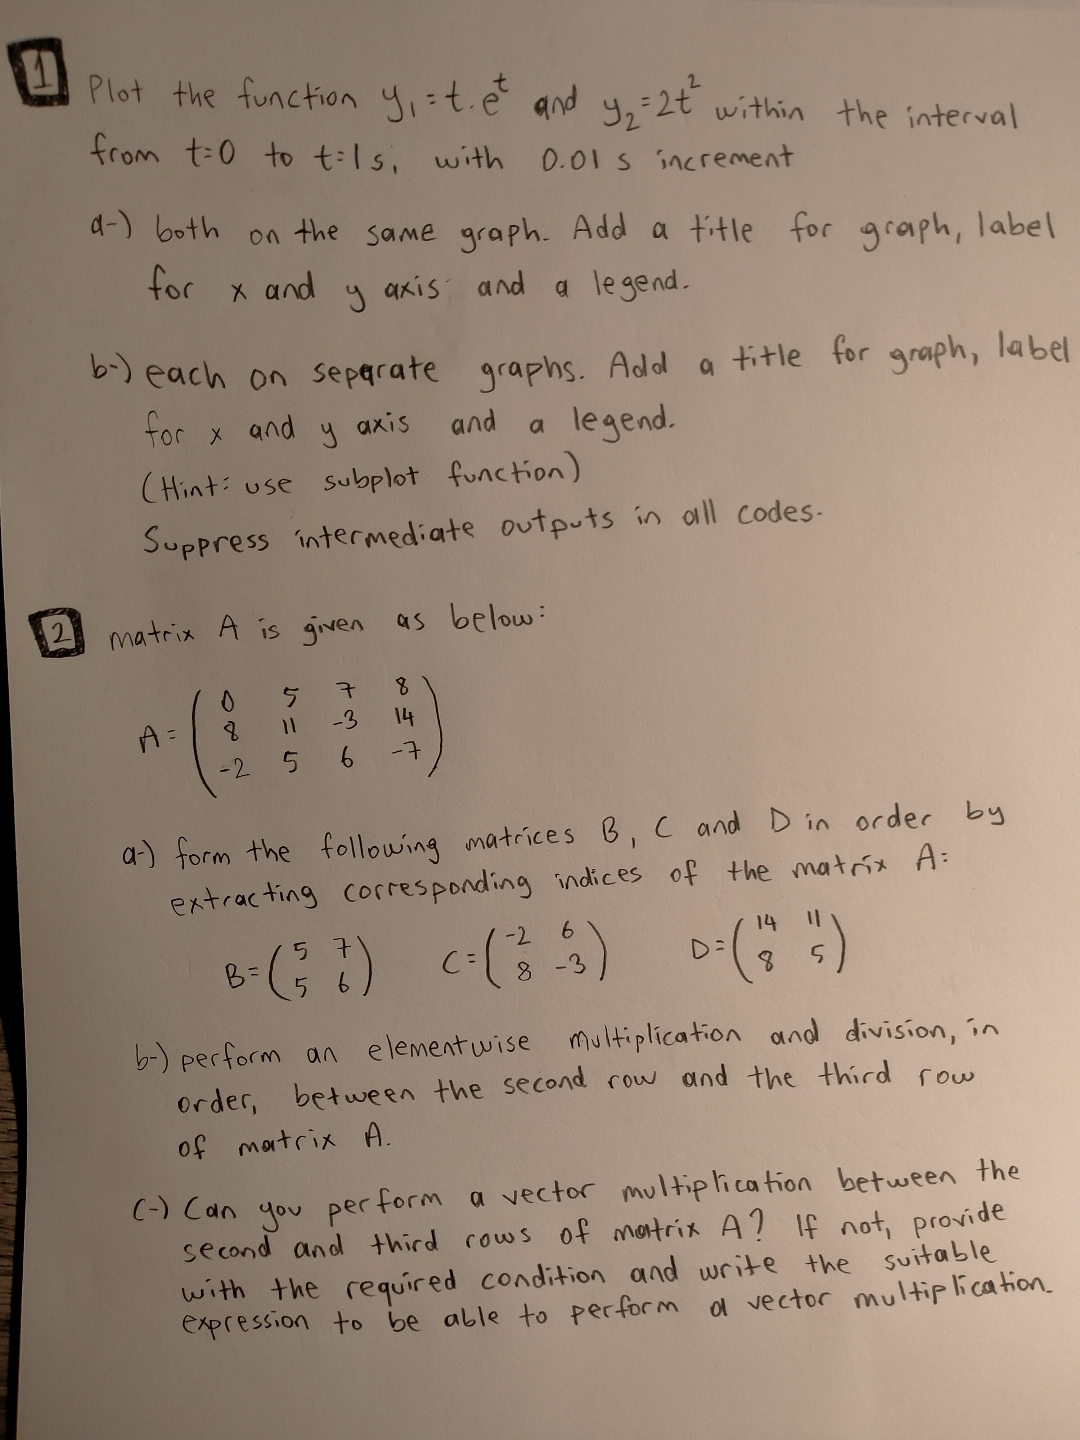
Question: ( 1 ) Plot the function y 1 = t * e t and y 2 = 2 t 2 within the interval from t
Plot the function and within the interval
from to with s increment
a both on the same graph. Add a title for graph, label
for and axis and a legend.
b each on separate graphs. Add a title for graph, label
for and axis and a legend.
Hint: use subplot function
Suppress intermediate outputs in all codes.
Matrix is given as below:
a form the following matrices and in order by
extracting corresponding indices of the matrix :
b perform an elementwise multiplication and division, in
order, between the second row and the third row
of matrix
c Can you perform a vector multiplication between the
second and third rows of matrix If not, provide
with the required condition and write the suitable
expression to be able to perform a vector multiplication.
Step by Step Solution
There are 3 Steps involved in it
1 Expert Approved Answer
Step: 1 Unlock

Question Has Been Solved by an Expert!
Get step-by-step solutions from verified subject matter experts
Step: 2 Unlock
Step: 3 Unlock