

Question: 1. Plot the standard titration curve in Excel by plotting Volume of Titrant (mL) on the x-axis and pH on the y- axis. Label the
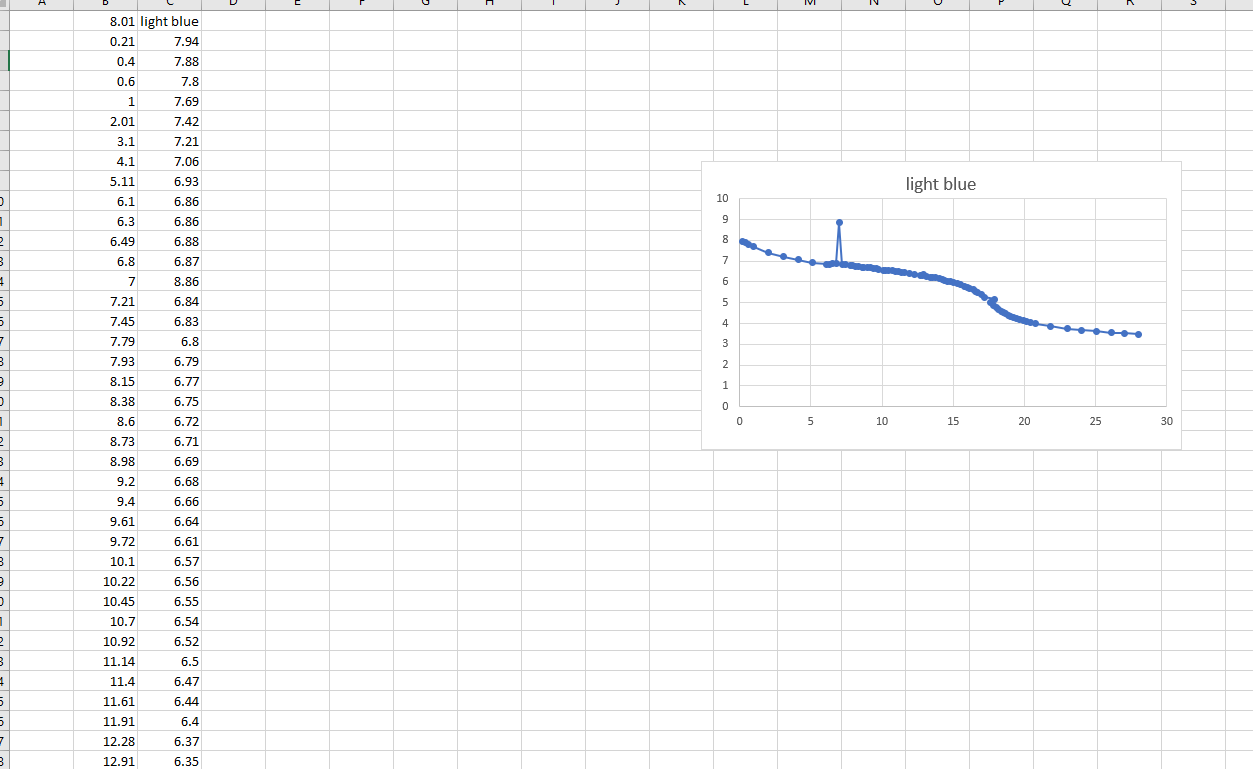
1. Plot the standard titration curve in Excel by plotting Volume of Titrant (mL) on the x-axis and pH on the y- axis. Label the titration curve indicating both equivalence points and half equivalence points. Give your graph a descriptive title.
2. Calculate the concentration of CaCO3 based on the volume and molarity of the titrant solution.
a. Using the molarity and volume of titrant added, determine the moles of titrant added to your solution at the second endpoint of the titration.
b. Using molecular equation, calculate the moles of calcium carbonate titrated.
c. Based on (b), calculate the concentration of calcium carbonate in units of ppm or mg/L. This is a measure of the total alkalinity of your water sample.
3. Determine the pKa for the bicarbonate ion from the first half equivalence point (Point B in Figure 1).
a. Convert the pKa for the bicarbonate ion to the pKb for the carbonate ion in the reaction below.
b. Calculate the Kb for the carbonate ion in the reaction below. H3 O+ (aq )+C O3 2(aq) HC O3 (aq)+ H 2O
4. Determine the pKa for carbonic acid from the second half equivalence point (point D in Figure 1).
a. Convert the pKa for carbonic acid to the pKb for the bicarbonate ion in the reaction below.
b. Calculate the Kb for the bicarbonate ion in the reaction below. H3 O+ (aq )+ HC O3 ( aq ) H2 CO 3 (aq )+ H 2 O (l ) 5. Calculate the relative error for each of the following: a. Concentration of Na2CO3
b. pKb of carbonate ion (Hint: check your textbook.)
c. pKb of bicarbonate ion (Hint: check your textbook.)
6. Comment on your calculated relative errors. How accurate were your results?
IVI 8.01 light blue 0.21 7.94 0.4 7.88 0.6 7.8 1 7.69 2.01 7.42 7.21 3.1 4.1 7.06 6.93 5.11 light blue 6.1 10 6.86 6.86 6.3 9 8 6.49 6.8 6.88 6.87 7 6 1 2 3 1 5 5 7 3 7 7 7.21 8.86 6.84 5 5 6.83 4 7.45 7.79 6.8 3 6.79 2 7.93 8.15 6.77 1 8.38 0 8.6 6.75 6.72 6.71 0 5 10 15 20 25 1 2 30 8.73 B 8.98 6.69 9.2 4 5 9.4 6.68 6.66 6.64 5 7 6.61 B 9.61 9.72 10.1 10.22 10.45 6.57 6.56 6.55 10.7 6.54 1 2 10.92 3 11.14 6.52 6.5 6.47 4 11.4 5 5 7 6.44 6.4 11.61 11.91 12.28 12.91 6.37 6.35 3
Step by Step Solution
There are 3 Steps involved in it

Get step-by-step solutions from verified subject matter experts