

Question: (1 point) (a) Create a frequency distribution table with 5 classes from the following data. Include classes, frequencies, class boundaries, and relative frequencies as percentages.
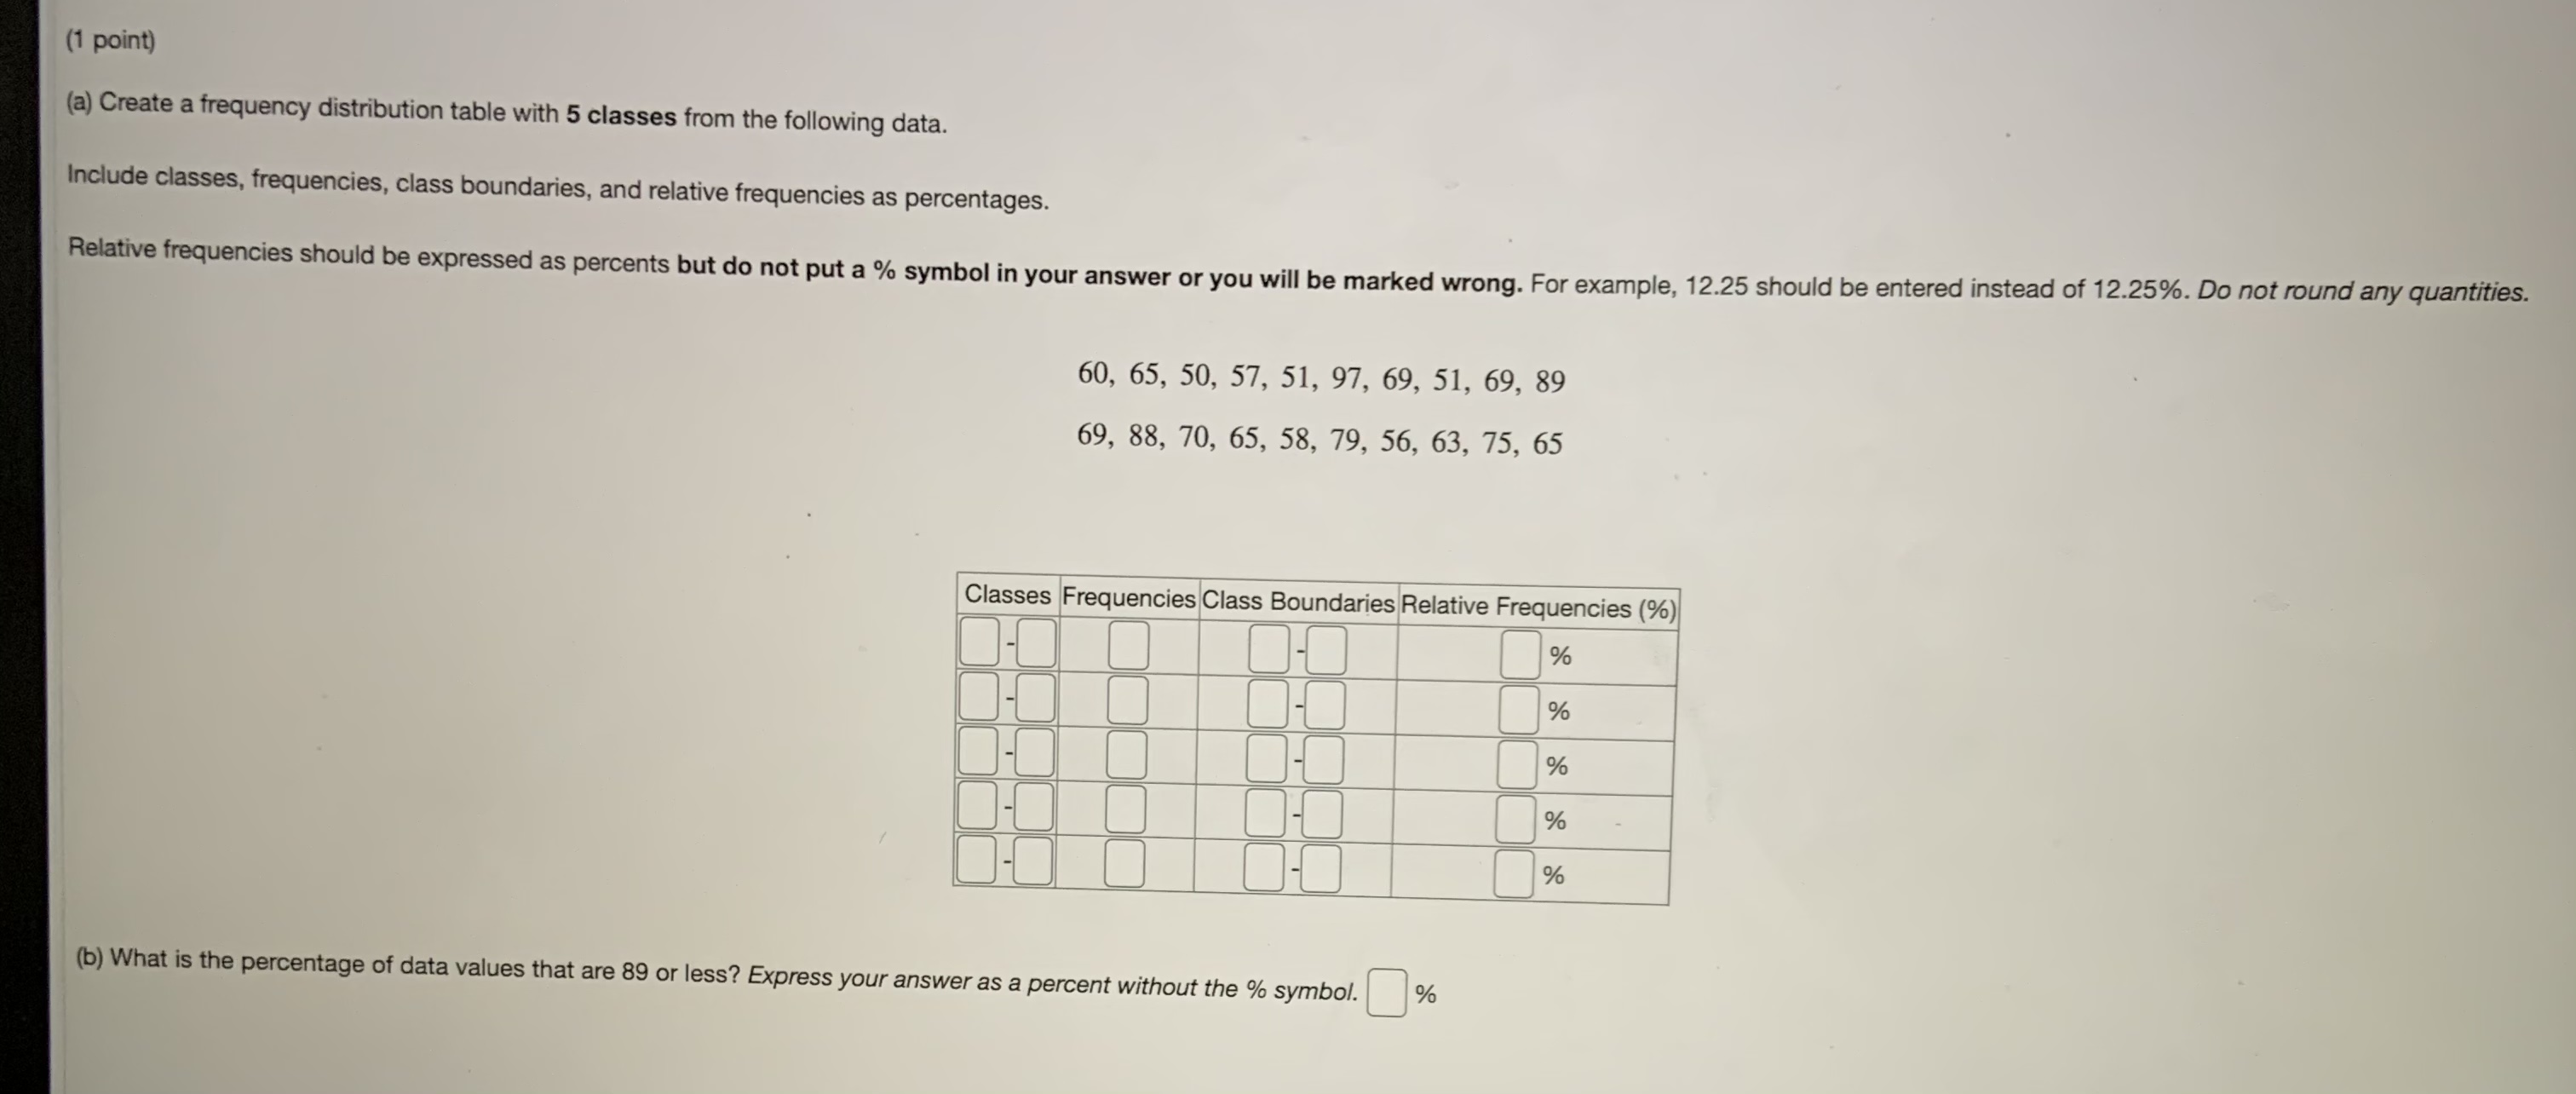
(1 point) (a) Create a frequency distribution table with 5 classes from the following data. Include classes, frequencies, class boundaries, and relative frequencies as percentages. Relative frequencies should be expressed as percents but do not put a % symbol in your answer or you will be marked wrong. For example, 12.25 should be entered instead of 12.25%. Do not round any quantities. 60, 65, 50, 57, 51, 97, 69, 51, 69, 89 69, 88, 70, 65, 58, 79, 56, 63, 75, 65 Classes Frequencies Class Boundaries Relative Frequencies (%) % % % % (b) What is the percentage of data values that are 89 or less? Express your answer as a percent without the % symbol. %
Step by Step Solution
There are 3 Steps involved in it

Get step-by-step solutions from verified subject matter experts