

Question: (a) Create a frequency distribution table with 8 classes from the following data. Include classes. frequencies, class midpoints, class boundaries, and relative frequencies as peroentages.
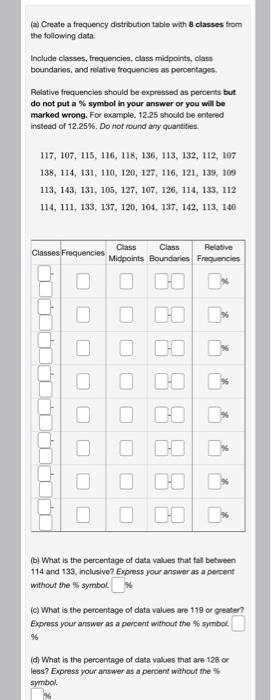
(a) Create a frequency distribution table with 8 classes from the following data. Include classes. frequencies, class midpoints, class boundaries, and relative frequencies as peroentages. Relative frequencies should be expressed as percents but do not put a \% symbol in your answer or you will be marked wrong. For example, 1225 shosid be entered instead of 12.25%. Do nof round arty quantities. (b) What is the percentage of data values that fall between 114 and 133, inclusive? Express your answor as a percent without the % symbot % (c) What is the percentage of data values are 119 or 9 eater? Express your answer as a percent wthout the % symbal 96 (d) What is the percentage of data values that are 128 or less? Express your answer as a percent without the s symbol
Step by Step Solution
There are 3 Steps involved in it

Get step-by-step solutions from verified subject matter experts