

Question: 1. Use the input and output temperatures (TH1, TH2, TC1, and TC2) to create simp temperature charts for each flow, similar to Figures below.
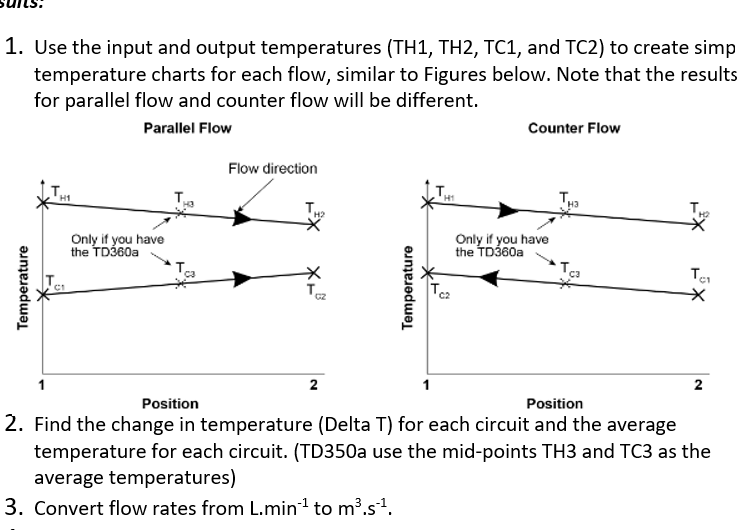
1. Use the input and output temperatures (TH1, TH2, TC1, and TC2) to create simp temperature charts for each flow, similar to Figures below. Note that the results for parallel flow and counter flow will be different. Parallel Flow Counter Flow Temperature 1 H1 Only if you have the TD360a Position Flow direction 2 T Temperature 1 H1 TH Only if you have the TD360a * Position 2 2. Find the change in temperature (Delta T) for each circuit and the average temperature for each circuit. (TD350a use the mid-points TH3 and TC3 as the average temperatures) 3. Convert flow rates from L.min to m.s.
Step by Step Solution
There are 3 Steps involved in it
Step 1 Analysis of Temperature Temperature profiles for Parallel Flow and Counter Flow differ due to ... View full answer

Get step-by-step solutions from verified subject matter experts