

Question: 1) What are the lower control limits for the 3-sigma X-bar chart? 2) What are the upper control limits for the 3-sigma X-bar chart? 3)
1) What are the lower control limits for the 3-sigma X-bar chart?
2) What are the upper control limits for the 3-sigma X-bar chart?
3) What are the lower control limits for the R chart?
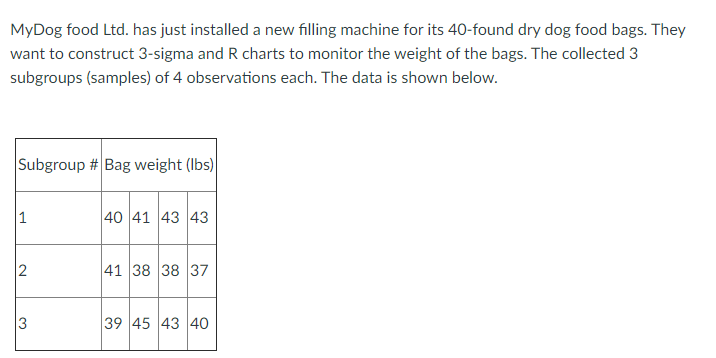
MyDog food Ltd. has just installed a new filling machine for its 40-found dry dog food bags. They want to construct 3-sigma and R charts to monitor the weight of the bags. The collected 3 subgroups (samples) of 4 observations each. The data is shown below. Subgroup # Bag weight (lbs) 1 40 41 43 43 N 41 38 38 37 3 39 45 43 40Step by Step Solution
There are 3 Steps involved in it
1 Expert Approved Answer
Step: 1 Unlock

Question Has Been Solved by an Expert!
Get step-by-step solutions from verified subject matter experts
Step: 2 Unlock
Step: 3 Unlock