

Question: 1) What is the average return for Home Depot, Inc. (HD)? 2) What is the standard deviation for Costo Wholesale Corporation (COST)? 3)What is the
1) What is the average return for Home Depot, Inc. (HD)? 2) What is the standard deviation for Costo Wholesale Corporation (COST)? 3)What is the correlation between BBY and MSFT? 4) What is the beta for Costo Wholesale Corporation (COST)?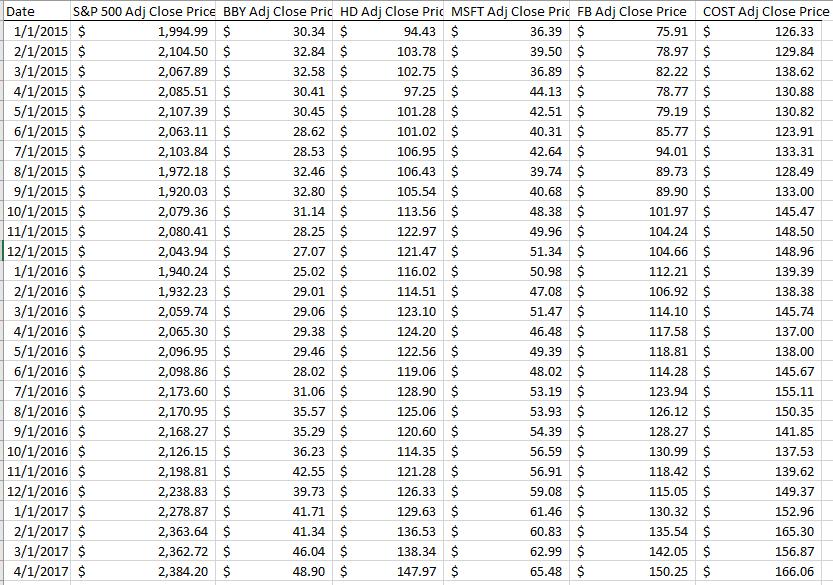
Date S&P 500 Adj Close Price BBY Adj Close Pric HD Adj Close Pric MSFT Adj Close Pric FB Adj Close Price 1/1/2015 $ 30.34 $ 36.39 $ 75.91 $ 2/1/2015 $ 32.84 $ 39.50 $ 78.97 $ 3/1/2015 $ 32.58 $ 36.89 $ 82.22 $ 30.41 $ 78.77 $ 30.45 $ 79.19 $ 28.62 $ 4/1/2015 $ 5/1/2015 $ 6/1/2015 $ 7/1/2015 $ 8/1/2015 $ 9/1/2015 $ 10/1/2015 $ 11/1/2015 $ 12/1/2015 $ 1/1/2016 $ 2/1/2016 $ 3/1/2016 $ 4/1/2016 $ 5/1/2016 $ 6/1/2016 $ 7/1/2016 $ 8/1/2016 $ 9/1/2016 $ 10/1/2016 $ 11/1/2016 $ 12/1/2016 $ 1/1/2017 $ 2/1/2017 $ 3/1/2017 $ 4/1/2017 $ 1,994.99 $ 2,104.50 $ 2,067.89 $ 2,085.51 $ 2,107.39 $ 2,063.11 $ 2,103.84 $ 1,972.18 $ 1,920.03 $ 2,079.36 $ 2,080.41 $ 2,043.94 $ 1,940.24 $ 1,932.23 $ 2,059.74 $ 2,065.30 $ 2,096.95 $ 2,098.86 $ 2,173.60 $ 2,170.95 $ 2,168.27 $ 2,126.15 $ 2,198.81 $ 2,238.83 $ 2,278.87 $ 2,363.64 $ $ 2,362.72 2,384.20 $ 28.53 $ 32.46 $ 32.80 $ 31.14 $ 28.25 $ 27.07 $ 25.02 $ 29.01 $ 29.06 $ 29.38 $ 29.46 $ 28.02 $ 31.06 $ 35.57 $ 35.29 $ 36.23 $ 42.55 $ 39.73 $ 41.71 $ 41.34 $ 46.04 $ 48.90 $ 94.43 $ 103.78 $ 102.75 $ 97.25 $ 101.28 $ 101.02 $ 106.95 $ 106.43 $ 105.54 $ 113.56 $ 122.97 $ 121.47 $ 116.02 $ 114.51 $ 123.10 $ 124.20 $ 122.56 $ 119.06 $ 128.90 125.06 $ $ 120.60 $ 114.35 $ 121.28 $ 126.33 $ 129.63 $ 136.53 $ 138.34 $ 147.97 $ 44.13 $ 42.51 $ COST Adj Close Price 40.31 $ 42.64 $ 39.74 $ 40.68 $ 48.38 $ 49.9 $ 51.34 $ 50.98 $ 47.08 $ 51.47 $ 46.48 $ 49.39 $ 48.02 $ 53.19 $ $ 53.93 54.39 $ 56.59 56.91 $ $ 59.08 $ 61.46 $ 60.83 $ 62.99 $ 65.48 $ 85.77 $ 94.01 $ 89.73 $ 89.90 $ 101.97 $ 104. $ 104.66 $ 112.21 $ 106.92 $ 114.10 $ 117.58 $ 118.81 $ 114.28 $ 123.94 $ 126.12 $ 128.27 $ 130.99 $ 118.42 $ 115.05 $ 130.32 $ 135.54 $ 142.05 $ 150.25 $ 126.33 129.84 138.62 130.88 130.82 123.91 133.31 128.49 133.00 145.47 148.50 148.96 139.39 138.38 145.74 137.00 138.00 145.67 155.11 150.35 141.85 137.53 139.62 149.37 152.96 165.30 156.87 166.06
Step by Step Solution
3.34 Rating (160 Votes )
There are 3 Steps involved in it
To answer the questions we need to calculate the average return standard deviation correlation and beta for the given stock data First lets organize the data Date SP 500 Adj Close Price BBY Adj Close ... View full answer

Get step-by-step solutions from verified subject matter experts