

Question: 1. What is the null hypothesis for your study? 2. What is the observed frequency for category 1? 3. What is the observed frequency for
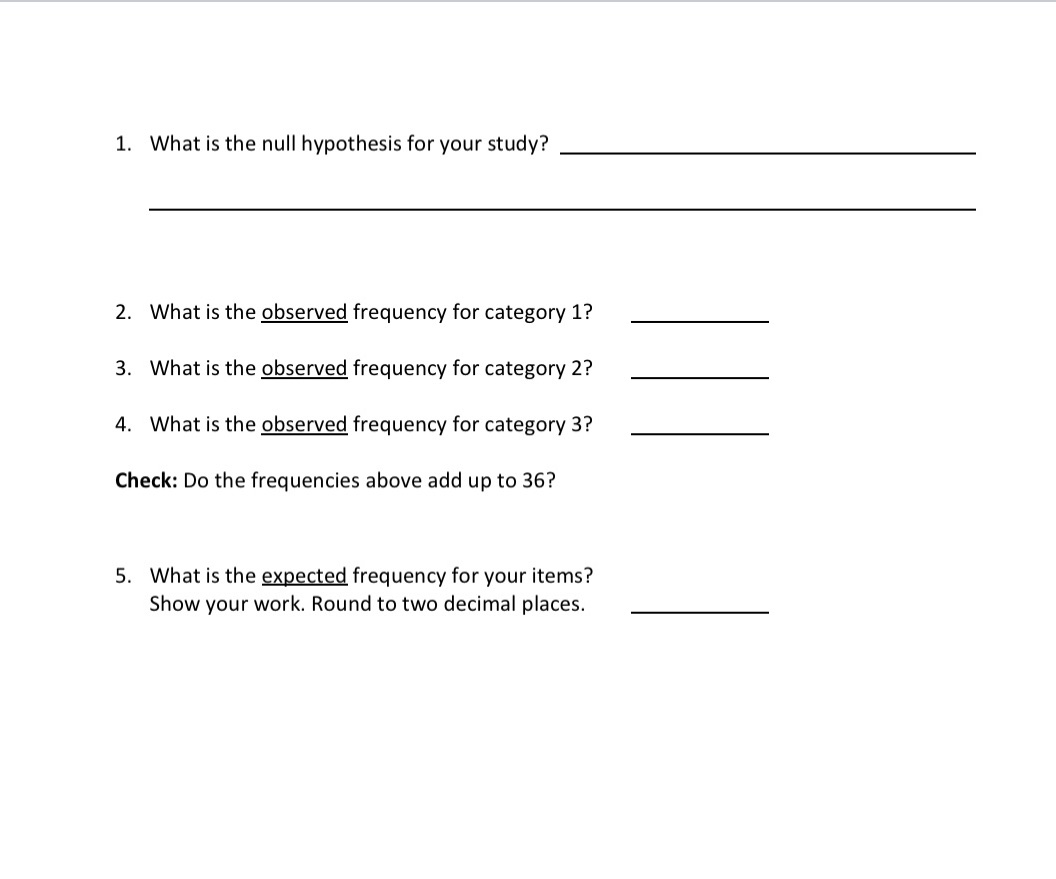
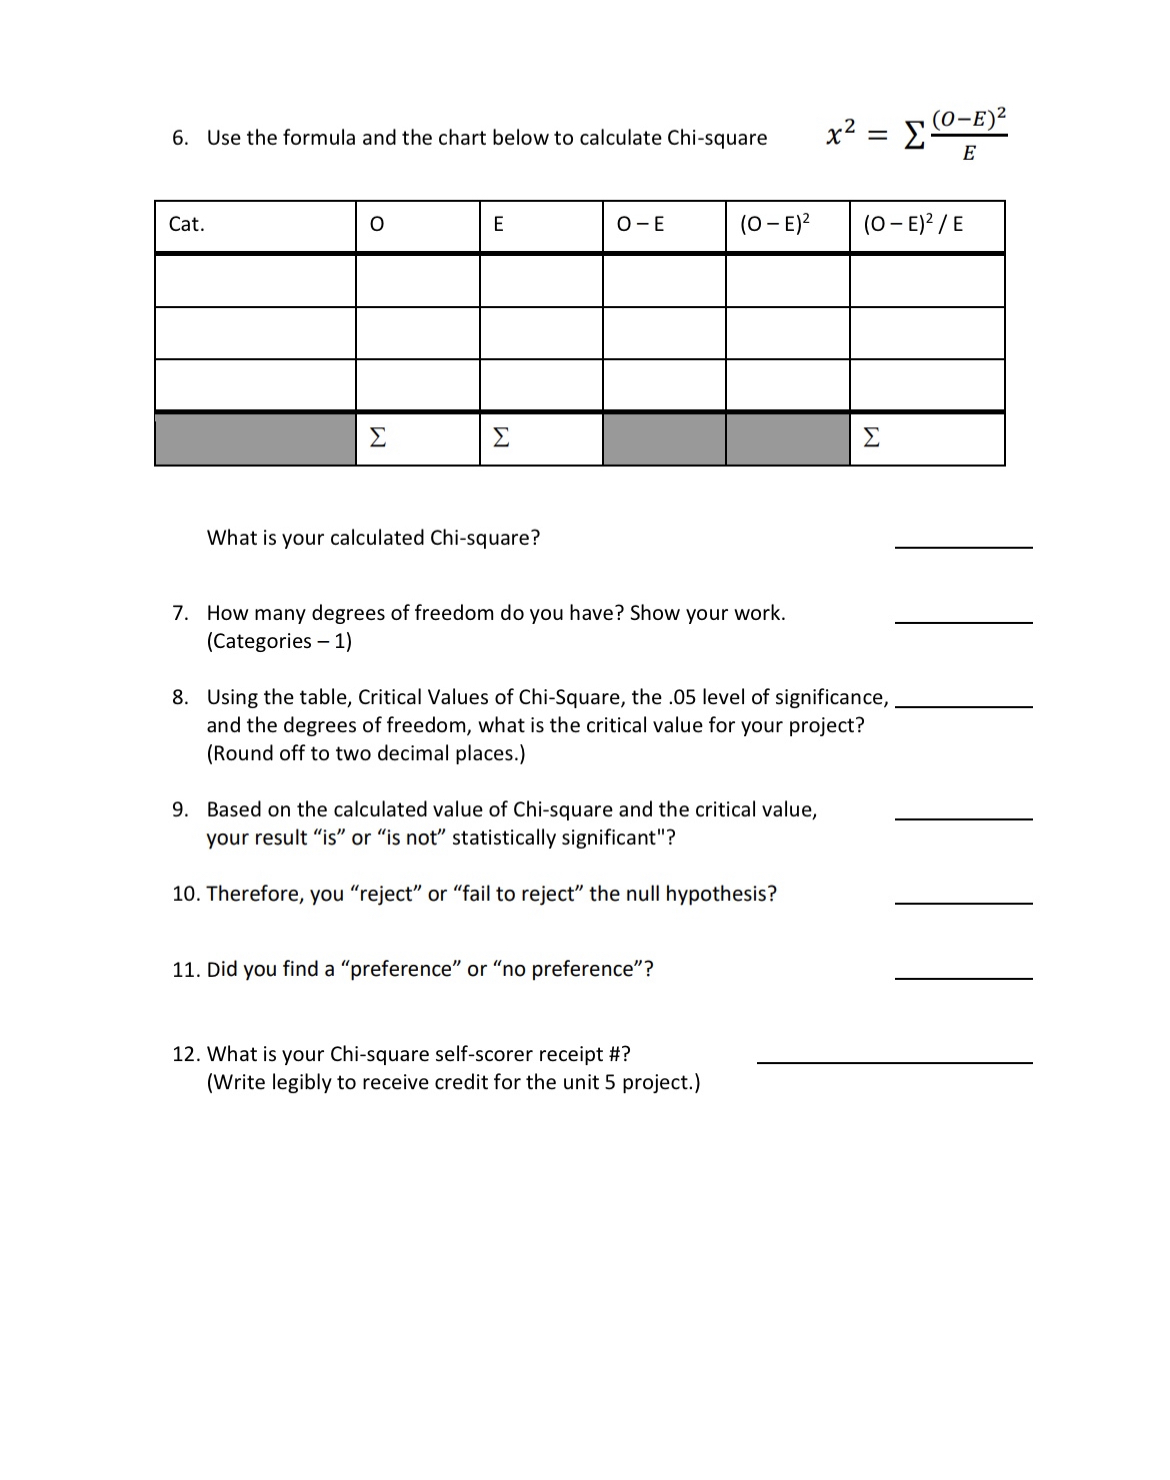
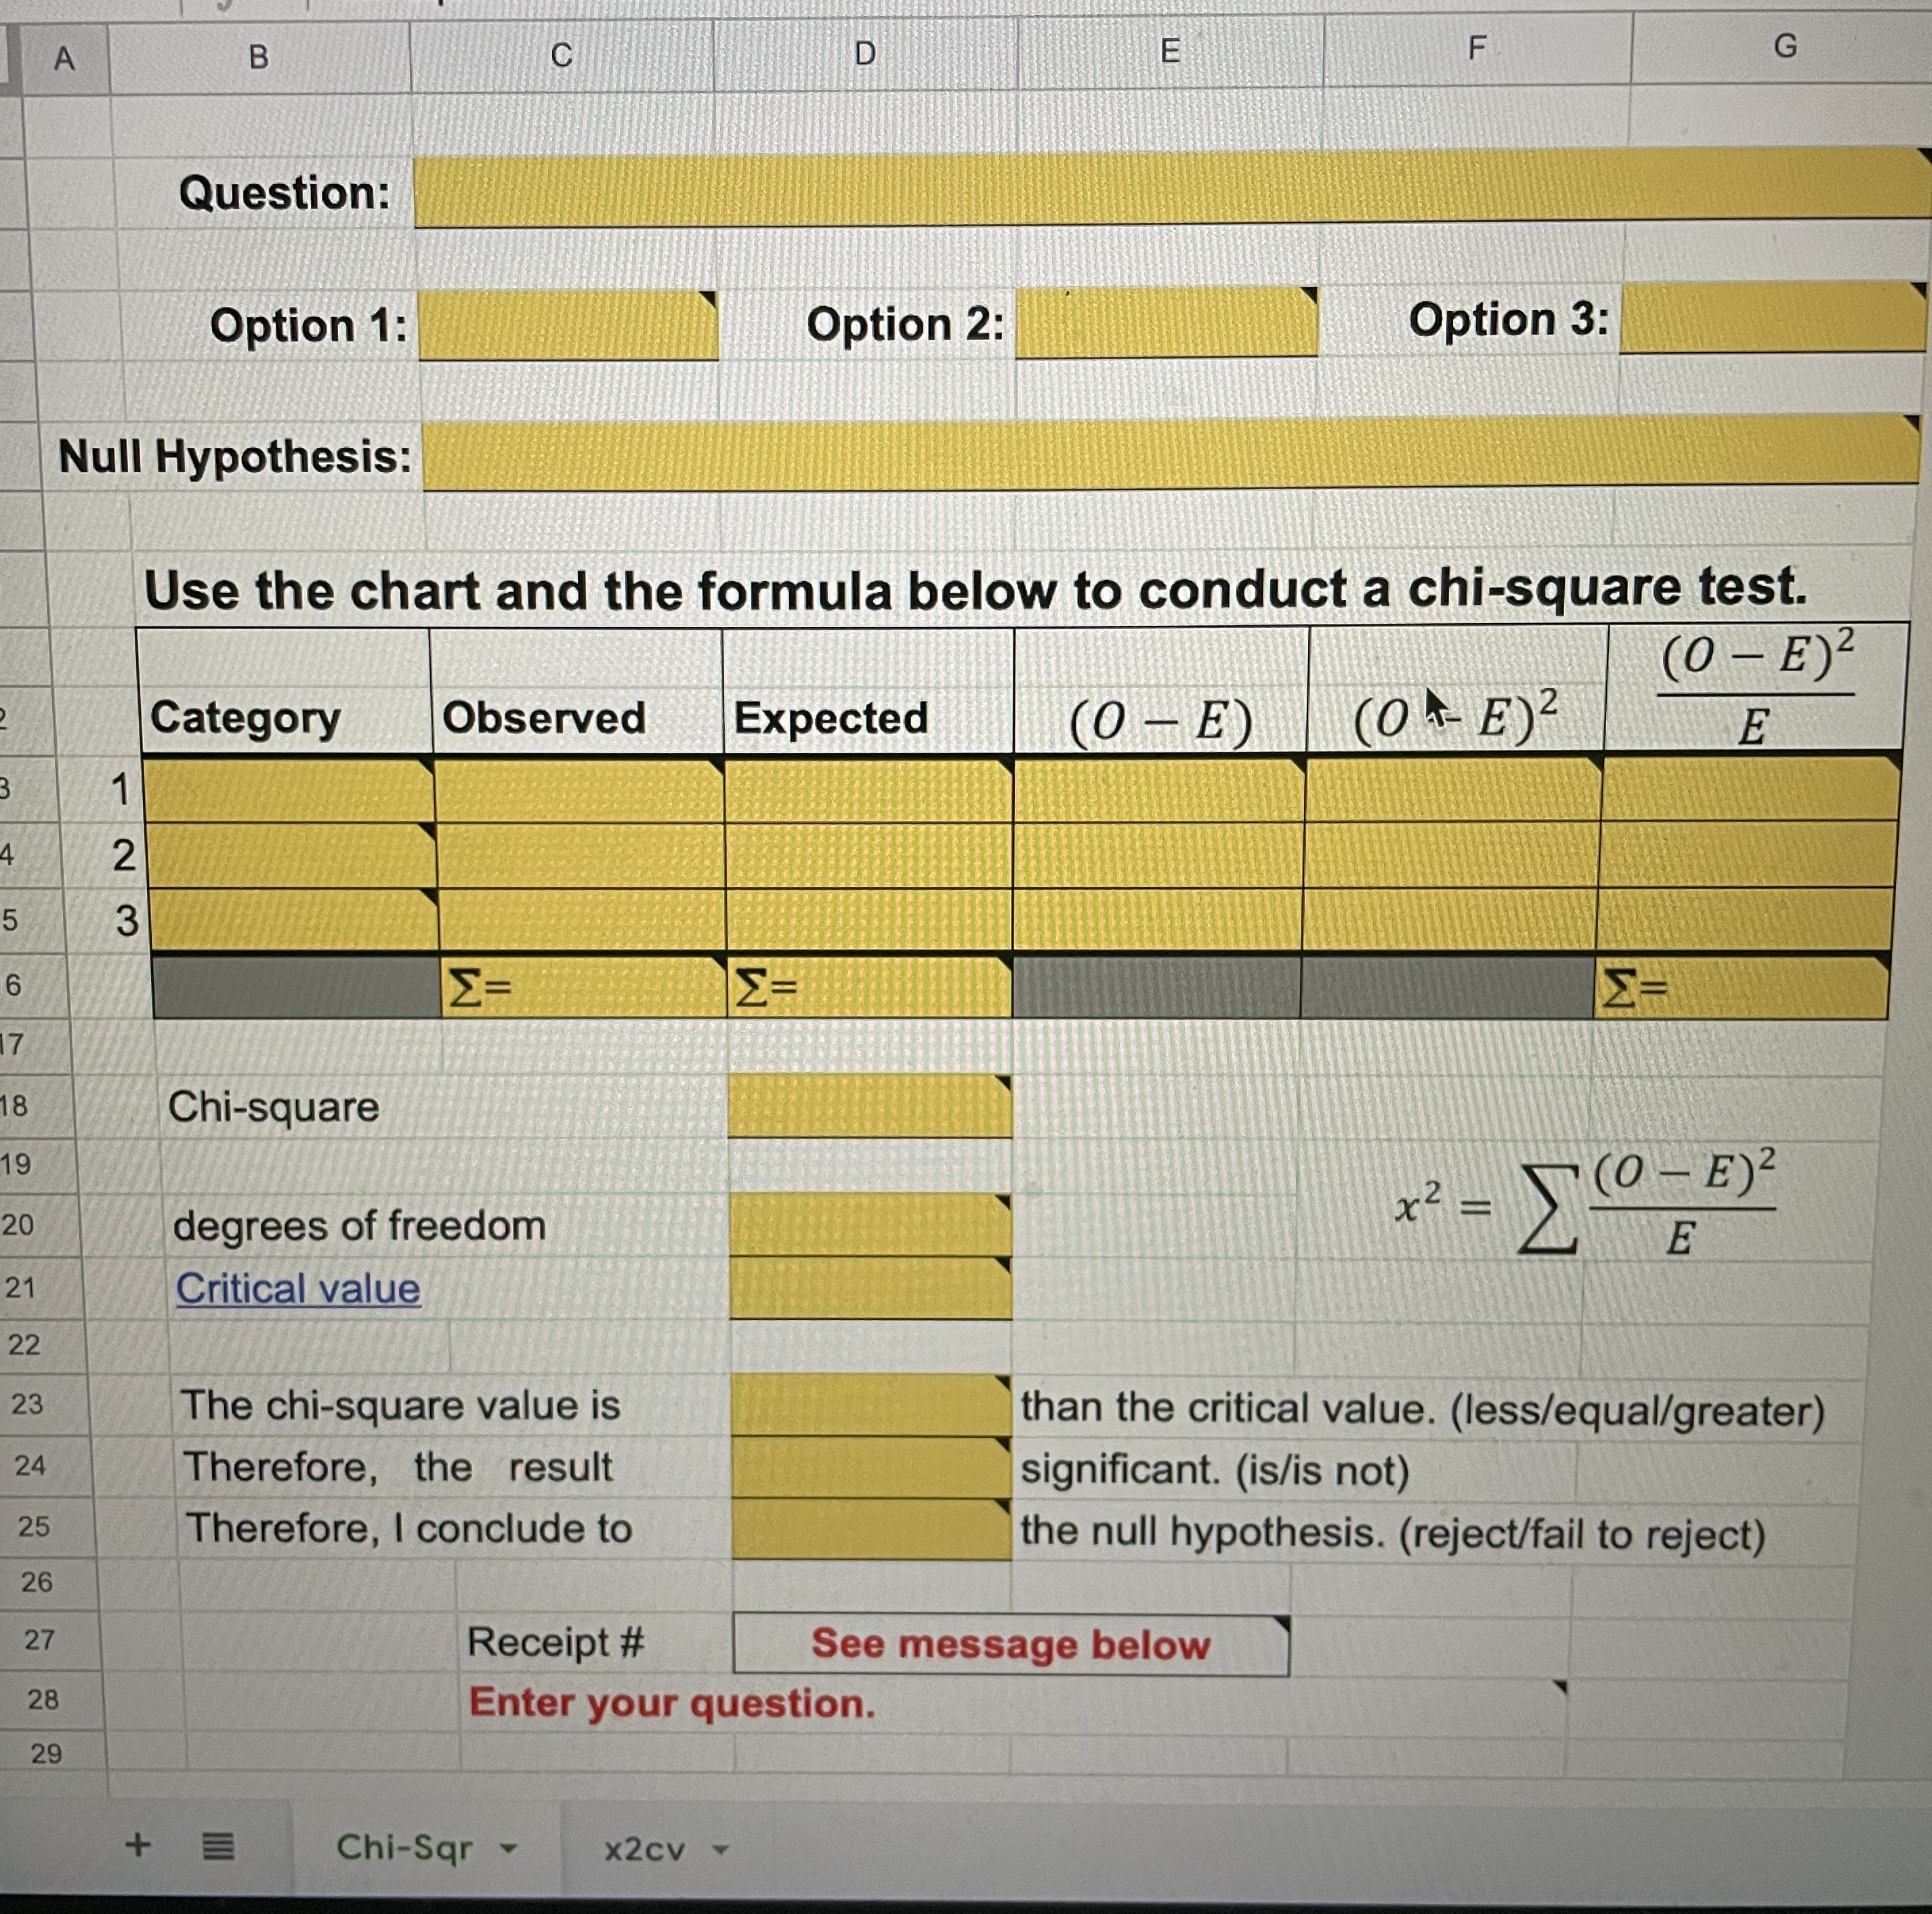
1. What is the null hypothesis for your study? 2. What is the observed frequency for category 1? 3. What is the observed frequency for category 2? 4. What is the observed frequency for category 3? Check: Do the frequencies above add up to 36? 5. What is the expected frequency for your items? Show your work. Round to two decimal places. 6. Use the formula and the chart below to calculate Chi-square 2_ (0-13)2 x 2 E What is your calculated Chi-square? 7. How many degrees of freedom do you have? Show your work. (Categories 1) 8. Using the table, Critical Values of Chi-Square, the .05 level of significance, and the degrees of freedom, what is the critical value for your project? (Round off to two decimal places.) 9. Based on the calculated value of Chi-square and the critical value, your result \"is\" or \"is not\" statistically significant"? 10. Therefore, you \"reject\" or \"fall to reject\" the null hypothesis? 11. Did you find a "preference" or "no preference\"? 12. What is your Chi-square self-scorer receipt ll? (Write legibly to receive credit for the unit 5 project.) E F A B C D G Question: Option 1: Option 2: Option 3: Null Hypothesis: Use the chart and the formula below to conduct a chi-square test. (0 - E)2 Category Observed Expected (0 - E) (04-E)2 E IN 6 E= E- 18 Chi-square 19 ( 0 - E ) 20 degrees of freedom x 2 - VE 21 Critical value 22 23 The chi-square value is than the critical value. (less/equal/greater) 24 Therefore, the result significant. (is/is not) 25 Therefore, I conclude to the null hypothesis. (reject/fail to reject) 26 27 Receipt # See message below 28 Enter your question. 29 + Chi-Sqr X2CV
Step by Step Solution
There are 3 Steps involved in it

Get step-by-step solutions from verified subject matter experts