

Question: 1. What shape (function) does the graph seem to follow? Does it agree with the expected theory for radioactive decay? 2. If you started
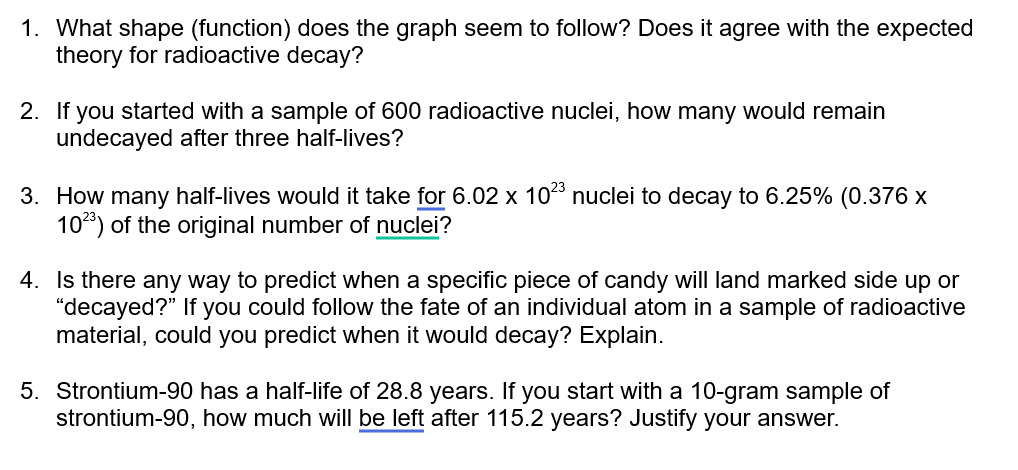
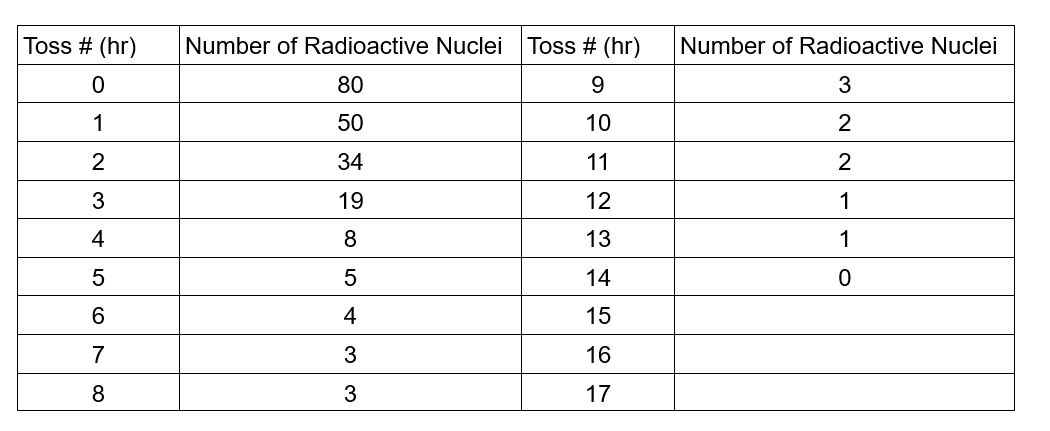
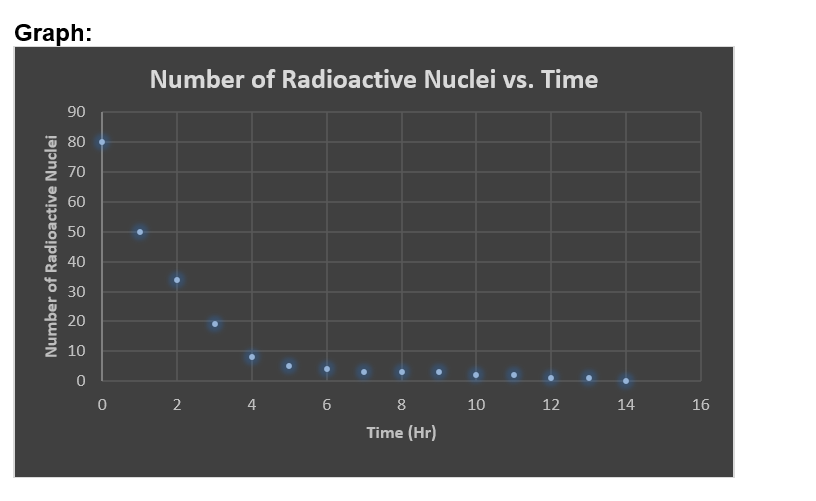
1. What shape (function) does the graph seem to follow? Does it agree with the expected theory for radioactive decay? 2. If you started with a sample of 600 radioactive nuclei, how many would remain undecayed after three half-lives? 3. How many half-lives would it take for 6.02 x 10²³ nuclei to decay to 6.25% (0.376 x 10²³) of the original number of nuclei? 4. Is there any way to predict when a specific piece of candy will land marked side up or "decayed?" If you could follow the fate of an individual atom in a sample of radioactive material, could you predict when it would decay? Explain. 5. Strontium-90 has a half-life of 28.8 years. If you start with a 10-gram sample of strontium-90, how much will be left after 115.2 years? Justify your answer. Toss # (hr) Number of Radioactive Nuclei Toss # (hr) Number of Radioactive Nuclei 0 80 9 3 1 50 10 2 2 34 11 2 3 19 12 1 4 8 13 1 5 5 14 0 6 4 15 7 8 33 16 17 Graph: Number of Radioactive Nuclei 90 80 70 60 50 40 30 20 10 0 Number of Radioactive Nuclei vs. Time 0 2 4 6 8 10 12 14 16 Time (Hr)
Step by Step Solution
There are 3 Steps involved in it

Get step-by-step solutions from verified subject matter experts