

Question: 1. You have the experimental data in the table below for a mixture of Methanol (1) and Benzene (2) in VLE at a temperature of
1. You have the experimental data in the table below for a mixture of Methanol (1) and Benzene (2) in VLE at a temperature of 90 C. (a) Plot the pressure in bar as a function X over the entire range of x, from 0 to 1 and label the curve as bubble or dew point curve as appropriate. (b) Determine the parameters for the two-suffix Margules equations from the experimental values at x = 0.376. (c) Use the parameters to plot a fit of the pressure over the entire Xx range. Comment on the findings and methods to possibly improve the fit. X1 Y 0.117 0.502 0.257 0.594 0.376 0.618 0.549 0.65 0.707 0.689 0.856 0.765 mm Hg 1865 2113 2218 2273 2292 2208
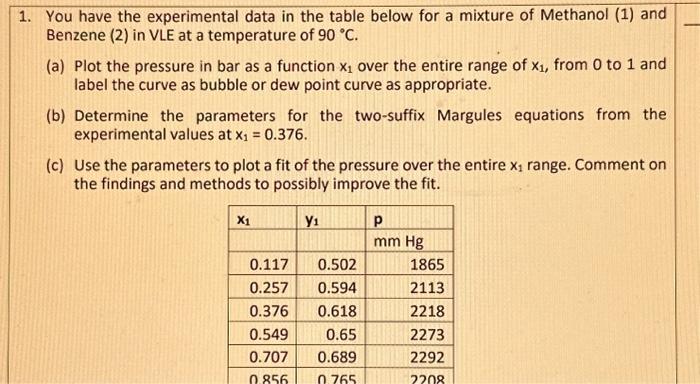
You have the experimental data in the table below for a mixture of Methanol (1) and Benzene (2) in VLE at a temperature of 90C. (a) Plot the pressure in bar as a function x1 over the entire range of x1, from 0 to 1 and label the curve as bubble or dew point curve as appropriate. (b) Determine the parameters for the two-suffix Margules equations from the experimental values at x1=0.376. (c) Use the parameters to plot a fit of the pressure over the entire x1 range. Comment on the findings and methods to possibly improve the fit
Step by Step Solution
There are 3 Steps involved in it
1 Expert Approved Answer
Step: 1 Unlock

Question Has Been Solved by an Expert!
Get step-by-step solutions from verified subject matter experts
Step: 2 Unlock
Step: 3 Unlock