

Question: must use Mathematica to complete this assignment Homework 4: Using the Redlich - Kwong equation of state, determine the saturation temperature, liquid volume, and vapor
 must use Mathematica to complete this assignment
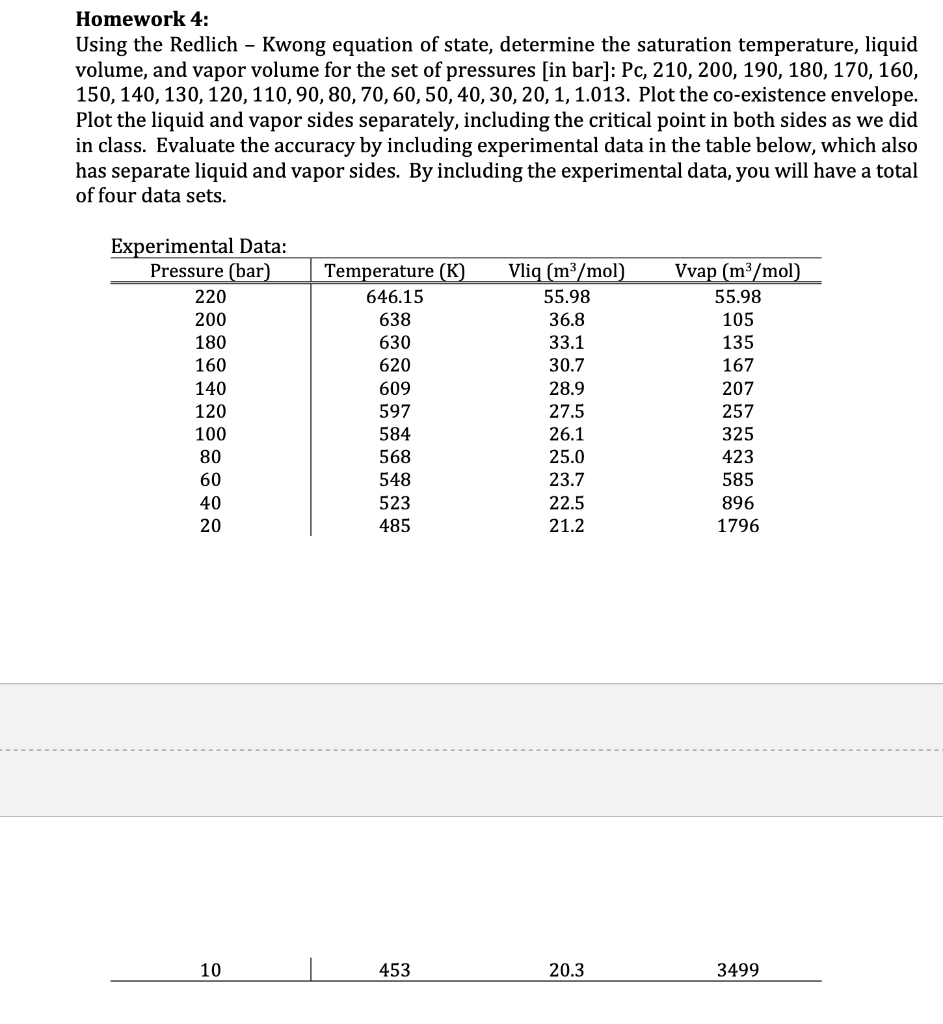
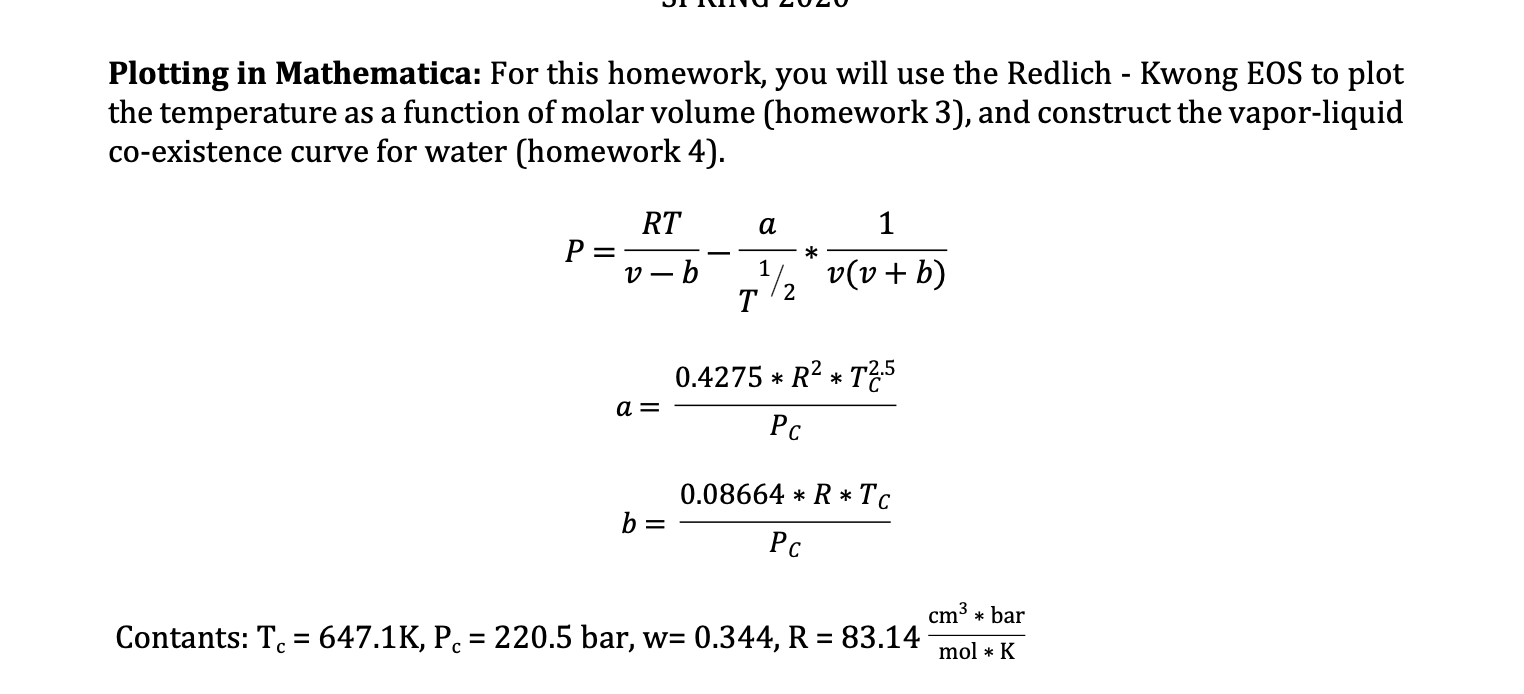
Homework 4: Using the Redlich - Kwong equation of state, determine the saturation temperature, liquid volume, and vapor volume for the set of pressures [in bar]: Pc, 210, 200, 190, 180, 170, 160, 150, 140, 130, 120, 110, 90, 80, 70,60,50,40,30, 20, 1, 1.013. Plot the co-existence envelope. Plot the liquid and vapor sides separately, including the critical point in both sides as we did in class. Evaluate the accuracy by including experimental data in the table below, which also has separate liquid and vapor sides. By including the experimental data, you will have a total of four data sets. Temperature (K) 646.15 Experimental Data: Pressure (bar) 220 200 180 160 140 120 638 630 620 609 Vliq (m3/mol) 55.98 36.8 33.1 30.7 28.9 27.5 26.1 25.0 23.7 22.5 21.2 Vvap (m3/mol) 55.98 105 135 167 207 257 325 423 585 896 1796 597 584 568 548 523 485 10 | 453 20.3 3499 UIIIIU LULU Plotting in Mathematica: For this homework, you will use the Redlich - Kwong EOS to plot the temperature as a function of molar volume (homework 3), and construct the vapor-liquid co-existence curve for water (homework 4). RT a 1 P=v-b-17,* v(v + b) 0.4275 * R2 * T2:5 a= Pc 0.08664 * R*TC b= PC cm3 * bar Contants: T. = 647.1K, Pc = 220.5 bar, w= 0.344, R = 83.14 mol * K Homework 4: Using the Redlich - Kwong equation of state, determine the saturation temperature, liquid volume, and vapor volume for the set of pressures [in bar]: Pc, 210, 200, 190, 180, 170, 160, 150, 140, 130, 120, 110, 90, 80, 70,60,50,40,30, 20, 1, 1.013. Plot the co-existence envelope. Plot the liquid and vapor sides separately, including the critical point in both sides as we did in class. Evaluate the accuracy by including experimental data in the table below, which also has separate liquid and vapor sides. By including the experimental data, you will have a total of four data sets. Temperature (K) 646.15 Experimental Data: Pressure (bar) 220 200 180 160 140 120 638 630 620 609 Vliq (m3/mol) 55.98 36.8 33.1 30.7 28.9 27.5 26.1 25.0 23.7 22.5 21.2 Vvap (m3/mol) 55.98 105 135 167 207 257 325 423 585 896 1796 597 584 568 548 523 485 10 | 453 20.3 3499 UIIIIU LULU Plotting in Mathematica: For this homework, you will use the Redlich - Kwong EOS to plot the temperature as a function of molar volume (homework 3), and construct the vapor-liquid co-existence curve for water (homework 4). RT a 1 P=v-b-17,* v(v + b) 0.4275 * R2 * T2:5 a= Pc 0.08664 * R*TC b= PC cm3 * bar Contants: T. = 647.1K, Pc = 220.5 bar, w= 0.344, R = 83.14 mol * K
Step by Step Solution
There are 3 Steps involved in it

Get step-by-step solutions from verified subject matter experts