

Question: You have the experimental data in the table below for a mixture of Methanol (1) and Benzene (2) in VLE at a temperature of 90C.
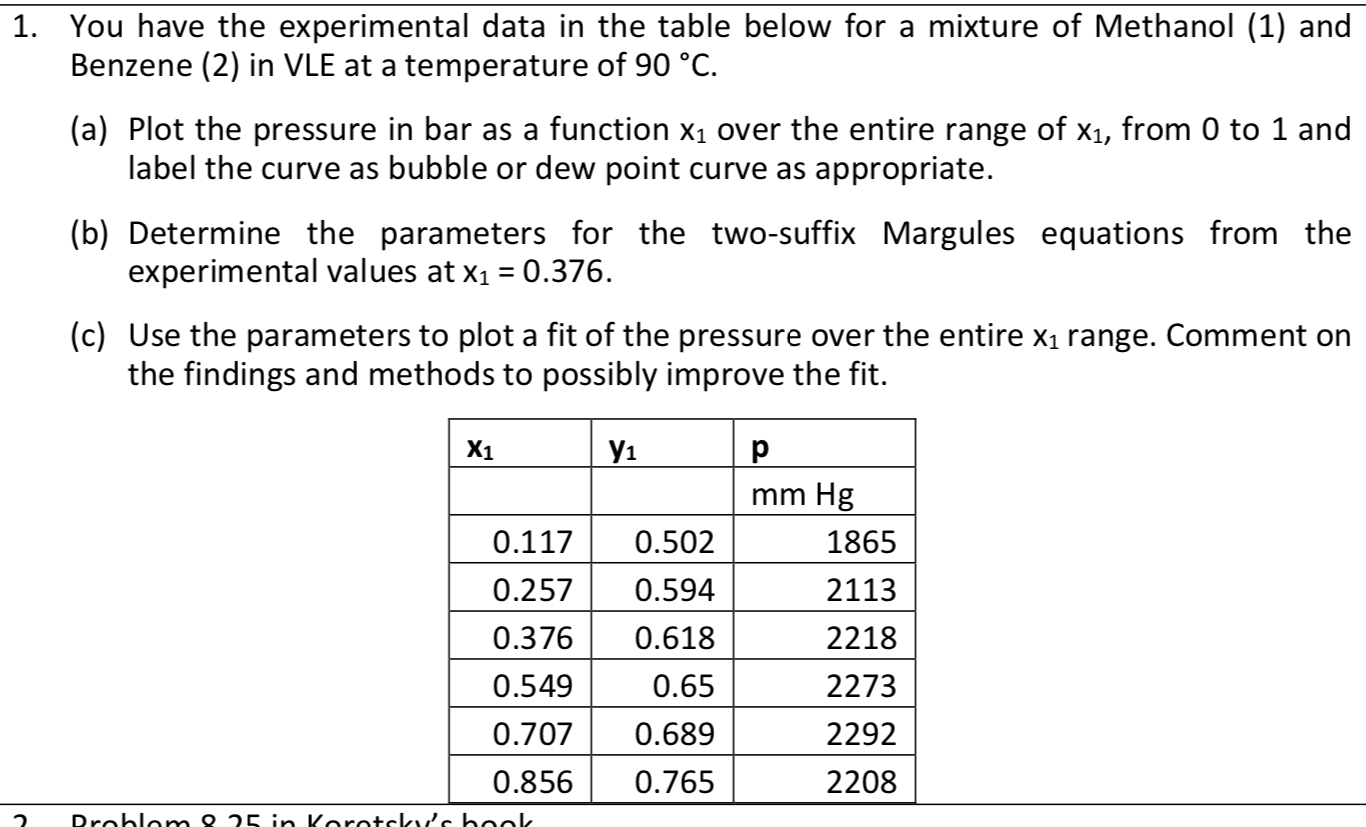
You have the experimental data in the table below for a mixture of Methanol (1) and Benzene (2) in VLE at a temperature of 90C. (a) Plot the pressure in bar as a function x1 over the entire range of x1, from 0 to 1 and label the curve as bubble or dew point curve as appropriate. (b) Determine the parameters for the two-suffix Margules equations from the experimental values at x1=0.376. (c) Use the parameters to plot a fit of the pressure over the entire x1 range. Comment on the findings and methods to possibly improve the fit. You have the experimental data in the table below for a mixture of Methanol (1) and Benzene (2) in VLE at a temperature of 90C. (a) Plot the pressure in bar as a function x1 over the entire range of x1, from 0 to 1 and label the curve as bubble or dew point curve as appropriate. (b) Determine the parameters for the two-suffix Margules equations from the experimental values at x1=0.376. (c) Use the parameters to plot a fit of the pressure over the entire x1 range. Comment on the findings and methods to possibly improve the fit
Step by Step Solution
There are 3 Steps involved in it

Get step-by-step solutions from verified subject matter experts