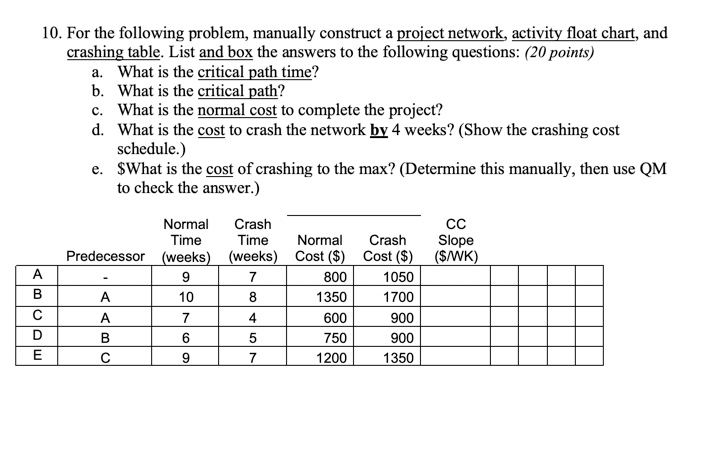
Question: 10. For the following problem, manually construct a project network, activity float chart, and crashing table. List and box the answers to the following questions:

10. For the following problem, manually construct10. For the following problem, manually construct

10. For the following problem, manually construct a project network, activity float chart, and crashing table. List and box the answers to the following questions: (20 points) a. What is the critical path time? b. What is the critical path? c. What is the normal cost to complete the project? d. What is the cost to crash the network by 4 weeks? (Show the crashing cost schedule.) e. What is the cost of crashing to the max? (Determine this manually, then use QM to check the answer.) CC Slope ($/WK) A B Normal Crash Time Time Normal Crash Predecessor (weeks) (weeks) Cost ($) Cost ($) 9 7 800 1050 A 10 8 1350 1700 A 7 4 900 B 6 5 900 9 7 1200 1350 D E 600 750 7. Use the table below for the following problem. (5 points) Time Estimates (days) a Activity 1 2 3 4 Pred 0 0 4 6 b 12 15 2 0 00 003 1 1 2 2 1 3 3 2 9 10 10 4 6 6 14 13 9 6 7 8 3 3,5,6 18 12 22 15 a. Determine the probability that the project completion time will exceed 35 days. b. Also determine the probability of the project being completed in less than 30 days

Step by Step Solution

There are 3 Steps involved in it

1 Expert Approved Answer
Step: 1 Unlock blur-text-image
Question Has Been Solved by an Expert!

Get step-by-step solutions from verified subject matter experts

Step: 2 Unlock
Step: 3 Unlock

Students Have Also Explored These Related General Management Questions!