

Question: 10. More crickets chirping The scatterplot shows the relationship between temperature in degrees Fahr- enheit (x) and chirps per minute (y) for the striped
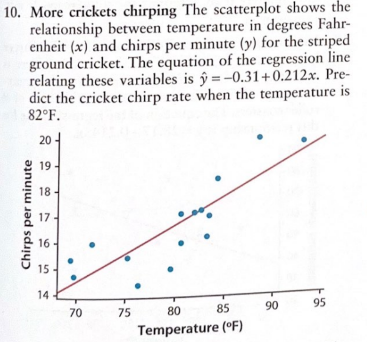
10. More crickets chirping The scatterplot shows the relationship between temperature in degrees Fahr- enheit (x) and chirps per minute (y) for the striped ground cricket. The equation of the regression line relating these variables is =-0.31+0.212x. Pre- dict the cricket chirp rate when the temperature is 82F. 20 210 Chirps per minute 19 18- 17 16 15 14 70 75 80 85 Temperature (F) 90 90 95
Step by Step Solution
There are 3 Steps involved in it
1 Expert Approved Answer
Step: 1 Unlock

Question Has Been Solved by an Expert!
Get step-by-step solutions from verified subject matter experts
Step: 2 Unlock
Step: 3 Unlock