

Question: 10. Using the data from Problem 9, continue your analysis of sample size and frequency by trying the following plans. a. Using the x-chart for
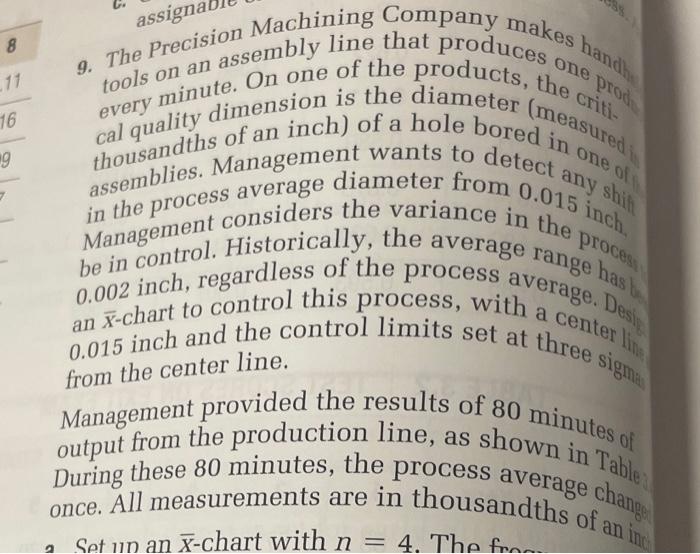
10. Using the data from Problem 9, continue your analysis of sample size and frequency by trying the following plans. a. Using the x-chart for n=4, try the frequency sample four, then skip eight. When would you stop the process in this case? b. Using the x-chart for n=8, try the frequency sample eight, then skip eight. When would you consider the process to be out of control? c. Using your results from parts (a) and (b), determine what trade-offs you would consider in choosing between them. 9. The Precision Madrly line that produces of han tools on an ass. On one of the products, the pere proter cal quality dimension is the diameter (meas of a hole bored in thousandths. Management wants to detect an an of in the process average diameter from 0.015 inch Management considers the variance in the prose be in control. Histless of the process average. hay Management provided the results of 80 minutes of output from the production line, as shown in Tab.es During these 80 minutes, the process average changet once. All measurements are in thousandths of an inge
Step by Step Solution
There are 3 Steps involved in it

Get step-by-step solutions from verified subject matter experts